Research Article - (2020) Volume 9, Issue 1
The field research was conducted at the Bhairahawa, Nepal in 2016/17 and 2017/18 in order to determine the physio-morphological and yield potential traits associated with heat and drought tolerance in wheat genotypes. The plant material consists of 20 genotypes out of which 17 were advanced lines and 3 were commercial varieties of Nepal. The research was carried out in alpha lattice design with two replications under three different environmental condition i.e. fully-irrigated, late sown and drought condition. In each replication there were 5 blocks consisting of 4 plots. Each plot was 4 m in length and 2.5 m in width. Each plot consists of 10 rows with a spacing of 25 cm between the rows and there was continuous sowing in a row. Seed sowing on Irrigated and Drought condition was done in 23rd November 2016 and 2017, similarly, seed sowing on Heat stress environment was done on 28th December 2016 and 2017. Data recoding were done for days to heading, days to maturity, plant height, grain yield, spikes/m2, number of grains per spike, thousand grain weights. The mean values of all yield potential traits in Heat stress and drought condition were less than in irrigated condition. Genotypes were significantly different for all phenological traits in irrigated heat stress and drought treatments. The mean number of days to heading for irrigated, drought and heat stress condition was 78.22, 76.58 and 60.8 respectively. The mean number of days to maturity for irrigated, drought and heat stress condition was 115.3, 110.41 and 99.25 respectively with the mean of 108 days. Similarly, mean plant height for irrigated, drought and heat stress condition was 89.53, 68.21 and 79.9 cm respectively with the mean of 81 cm. The mean spike/m2 for irrigated, drought and heat stress condition was 340.025, 226.11 and 262.73 respectively with the mean of 276.28. Similarly, the mean NGPS for irrigated, drought and heat stress condition was 43.32, 36.68 and 37 respectively with the mean of 39. The mean TKW for irrigated, drought and heat stress condition was 45.06,40.25 and 36.025 g respectively with the mean 40.445 g. It was observed significant difference in genotypes and environments for yield and yield potential traits. Genotype by environment interaction showed significant difference for grain yield. The mean grain yield for irrigated, drought and heat stress condition was 3.3, 1.4 and 1.79 ton/ha respectively with the mean of 2.18 ton/ha. Under normal irrigated condition, BL4708 highest mean yield with 3731.5 kg/ha and NL1328 yield lowest mean yield of 2.65 ton/ha. In heat stress condition BL4699 had maximum mean yield of 2.22 ton/ ha and NL1307 had minimum mean yield of 1.18 ton/ha. Similarly, in drought condition NL1327 had maximum mean yield of 2.0 ton/ha and NL1325 had minimum yield of 1.04 ton/ha.
Wheat, Heat stress, Drought, Irrigated, traits
Triticum aestivum, commonly known as wheat, is a cereal grass placed in family poaceae. Many species of wheat including Triticum aestivum and Triticum durum collectively make the genus Triticum. Wheat (Triticum aestivum) is the largest food crop to cover the earth’s surface (218.54 million hectares in 2017) and the second largest crop after maize in terms of the production (771.71 million tons in 2017) in the world [1]. Roughly 30.0% of the global cereal region is represented by wheat [2]. Worldwide, wheat production was about 729.5 million tons in 2014, exceeding the 717.2 million tons produced in 2013 [3]. Given the growing world population, wheat productivity is expected to reach 3.5 tons per hectare by 2033 [4]. However, the demand for wheat is also increasing, and is predicted to increase by 2.0% annually [5]. Developing nations are the biggest importers of wheat, which comprises about 34.0% of their imported food [6]. The European Union recorded the highest Grain production in 2014 at 156.1 million tons followed by China, India, the United States, the Russian Federation and Canada. Kazakhstan, Argentina, Ukraine, Australia and the Russian Federation are major wheat exporters. In 2014, the global wheat trade recorded 153.0 million tons, while wheat use was 711.7 million tonnes. Asia is the biggest import region, followed by Africa, South America, Central America and Europe [3]. According to Consultative Group for International Agricultural Research (CGIAR), 215 million hectare of the land are dedicated solely for the growth of wheat each year. Wheat is used as human food and fodder for livestock. It is consumed by over 2.5 billion people all over the world. Wheat has a high content of starch (60-70%) and 6-26% protein content. It is a good source of carbohydrates, fibers, minerals (2.1%), fat (2.10%), vitamins and sugars and meets half of the energy demand of human population [7]. Wheat is the most important cereal crop cultivated in Nepal after rice and maize and is ranked at 3rd position both in order of area and productivity. It occupies 21.7% of total cereal crop area and contributes 19.7% of the total cereal production in the country. The productivity of wheat in Nepal is almost constant ranging from 1.9 to 2.5 t/ha and very low compare to other developed nation like New Zealand and Ireland and comparable with other Asiatic country like Bangladesh and world since 2006. Presently, area under cultivation, production and productivity of wheat is 7,06,843 hectares, 1.95 million metric tons and 2.757 tons/ha respectively [8]. Until 2017, Nepal Agriculture Research Council (NARC) has released and recommends 43 wheat varieties for different agro ecological domains, i.e. 26 for Terai and 17 for hills. But, 13 wheat varieties have been denotified and only 30 varieties are under cultivation (NWRP, 2018).
Apart from yield potential, quality traits possessed by wheat seeds should be high temperature tolerance, drought tolerance and rust resistance. About 50 years ago, wheat in Nepal was cultivated only as a traditional crop but in 1960s Wheat genotypes that were photo insensitive and input responsive were introduced in Nepal from India because of it wheat turned into a commercial crop also in Nepal. On the road of evolution, wheat has gained appreciable genetic diversity form Emmer to the bread and Durum wheat. The number of wheat varieties being added to the database is increasing every year but due to modern breeding, the spectrum of genetic diversity is relatively reduced. Modern high yielding commercial varieties of wheat are being propagated discouraging the primitive wheat varieties leading to narrowed genetic diversity of wheat. The foundation for genetic improvement is genetic diversity. With narrowed genetic diversity, yield of a specie decreases in the face of abiotic stresses, e.g. drought and heat stress. Some plant varieties are more susceptible to abiotic stress and are known as susceptible plants while others wholly escape the adverse effects of stress. Wheat is the largest deficit item in the developing country food basket. Between 1970 and 2010, more than half of the increment in wheat consumption was met by increased wheat imports, and several countries became totally dependent on imports for wheat [1]. The Cereal Import Dependency Ratio, an indicator of a country’s dependency on the import of cereals calculated as the average of three years by FAO, of Nepal was 1.2 in 1990. It has risen to 1.7% in 2000, 3.9% in 2014 and 7.6% in 2016 [1,3]. Nepal imported 0.19 million metric ton of wheat worth NRs. 5.2 billion (approx. 48 million USD) in 2016/17 [8]. Demand of wheat is rising and it is expected that by 2050 the requirement of wheat would be 60% higher than the present year. Food security is the major challenge faced by human race in the 21st century [3]. The uncertainty in environmental condition will cause a reduction of 7% in the global crop yield. The limiting factors among abiotic stresses for wheat production worldwide are drought and heat [9,10].
The cultivation of wheat will be most affected because wheat is vulnerable to high temperature, drought and heat stress. Main limiting factor for wheat cultivation in Nepal is lack of water for wheat cultivation and genetic makeup [11]. Wheat is a mesophytic plant so for cultivation of wheat temperature range is relatively narrow and ranges from 10°C-15°C during sowing and 21°C-26°C during the ripening period though there are varieties of wheat that can even grow at 35°C. With every passing year, there is change in rainfall patterns, increase in Carbon dioxide and other greenhouse gases concentration along with decrease in annual precipitation [12]. The period 1980 to 2015 has been the warmest period of the 1400 year duration; global temperature has risen to about 0.85°C during this period. This climate change will have lethal effects on the natural systems. In many regions of the world there is alteration in the precipitation patterns and snow is melting. One of the consequences of climate change will be the reduced crop yield and it is believed to be the major risk in the realm of agriculture [13]. Among all the crops, wheat production will be highly reduced due to rise in temperature. If the global temperature rise just 1°C it would lead to fall in global wheat yield. Along with heat stress climate change would come with other problems one of them is drought. Drought is a period of dry weather that can extend from months to years and area under drought does not receive normal amount of rain. Temperature rise of 1°C increases evapotranspiration to about 3%-5%. Water requirement of wheat crop is estimated to be 266.8-500 mm which is much higher as compared to water requirement of other crops including maize [14]. Wheat yield is strongly influenced by the availability of water. By 2050, there is utter need for increasing crop yield from 50% to meet the requirements of increasing population. Breeders are striving for development of wheat varieties that can withstand heat and water stress.
Description of experimental site
The field experiment was conducted at Bhairahawa, Rupandehi, Nepal. Geographic location of the research site is 27º30ˈ N and 83º27ˈ E and at the altitude of 79 m above the sea level. This site has a humid sub-tropical climate where summers are hot and winters are cold with total annual rainfall as 1725.3 mm.
Soil properties
Soil sample was taken from the field after land preparation. The soil was air dried, ground sieved through mortar and pestle. The soil characteristics (Table 1) were analysed in National Wheat Research Program (NWRP), Bhairahawa. The details of the soil analysis are given below.
| Particulars | Physical properties | Organic matter(%) | Total Nitrogen (%) | Phosphorus (kg/ha) | Potash (kg/ha) | pH |
|---|---|---|---|---|---|---|
| Soils of the experimental site, Pakhlihawa | Clay loam | 3.351 | 0.49(high) | 187.53(high) | 123.11 | 5.2 (acidic) |
Table 1: Details of soil analysis.
Agro-metrological features
The agro-metrological information was collected from National Wheat Research Programme (NWRP), Bhairahawa, which is the nearest meteorological station from the research sites (Figure 1).
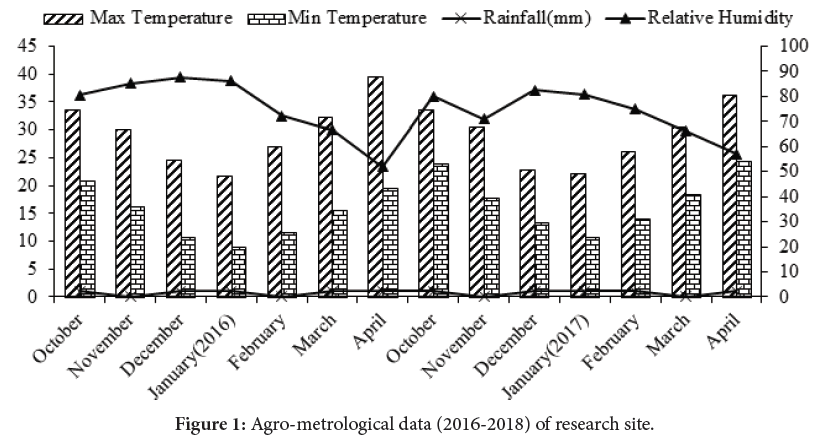
Figure 1. Agro-metrological data (2016-2018) of research site.
Plant materials
A set of 20 wheat genotypes were obtained from National Wheat Research Program (NWRP), Bhairahawa, Nepal. There were 4 Bhairahawa lines (BL), 13 Nepal lines (NL) and 3 commercial varieties. Bhrikuti, RR21 and Gautam were used as the standard check variety which was released as variety of Nepal. The complete sets of genotype with their entry names are presented in the Table 2.
| S.No | Genotypes | Source | Parentage | Released year |
|---|---|---|---|---|
| 1 | BL4335 | Bhairahawa | n.d | n.d |
| 2 | NL1202 | Mexico | n.d | n.d |
| 3 | NL1207 | Mexico | n.d | n.d |
| 4 | NL1211 | Mexico | n.d | n.d |
| 5 | NL1244 | Mexico | n.d | n.d |
| 6 | NL1247 | Mexico | n.d | n.d |
| 7 | NL1253 | Mexico | n.d | n.d |
| 8 | NL1254 | Mexico | n.d | n.d |
| 9 | BL4699 | Bhairahawa | n.d | n.d |
| 10 | BL4707 | Bhairahawa | n.d | n.d |
| 11 | BL4708 | Bhairahawa | n.d | n.d |
| 12 | NL4307 | Mexico | n.d | n.d |
| 13 | NL1260 | Mexico | n.d | n.d |
| 14 | NL1325 | Mexico | n.d | n.d |
| 15 | NL1326 | Mexico | n.d | n.d |
| 16 | NL1327 | Mexico | n.d | n.d |
| 17 | NL1328 | Mexico | n.d | n.d |
| 18 | BHRIKUTI | Mexico | CMT/COC75/3/PLO//FURY/ANA75 | 1994 |
| 19 | RR21 | India | 1154-388/AN/3/YT54/NIOB/RL64 | 1971 |
| 20 | GAUTAM | Nepal | SIDDHARTH/NING8319/NL297 | 2004 |
Table 2: List of genotypes used for the field experiment.
Design of the experimental plot and treatment combination
The field experiment was conducted following Alpha Lattice design (Figure 2) with five blocks and the block size of 4 plots, replicated twice, Irrigated as normal condition, drought as water stress and heat stress condition as late season. In each replication there were 5 blocks consisting of 4 plots. Each genotype was planted in a plot size of 10 m² (4 m × 2.5 m). Each plot was provided with rows with spacing of 25 cm between rows and there was continuous sowing as in line sowing method. There was gap of 0.5 m in each plot and 1 m gap between two replications.
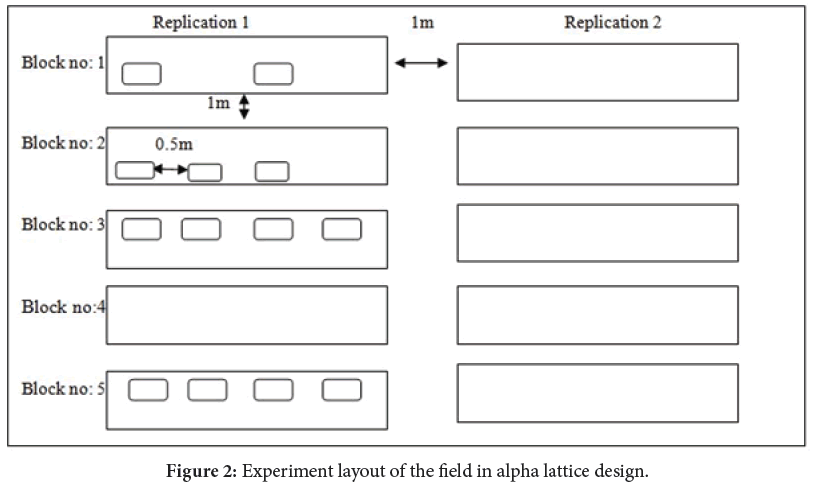
Figure 2. Experiment layout of the field in alpha lattice design.
Field preparation, sowing and crop management
The field was prepared by using tractor for deep ploughing followed by two harrowing with disc and with one manual levelling. The line sowing was done on 24th November for irrigated and drought stress condition and 24th December for heat stress condition at the seed rate of 120 kg/ha.
Fertilizer dose
Irrigated and heat stress condition: Compost manure at the rate of 5 ton/ha and the individual plots was fertilized with recommended dose of 100:50:25 kg NPK/ha. All the phosphorus, potash and half dose of nitrogen were applied before sowing. The remaining dose of nitrogen was applied in two split dose: a quarter at 30 DAS and the last dose at 70 DAS. One manual weeding was done during heading stage of plants. Five irrigations (Table 3) were given to irrigated and heat stress trail which are shown below whereas no irrigation was provided to drought condition.
| Irrigation | Stage of plant |
|---|---|
| 1st | Crown root initiation(CRI) |
| 2nd | Heading |
| 3rd | Flowering |
| 4th | Milking stage |
| 5th | Soft dough stage |
Table 3: Irrigation scheduling of wheat for irrigated and heat stress condition.
Drought condition: Compost manure at the rate of 5 ton/ha and the individual plots was fertilized with recommended dose of 50:50:20 kg NPK/ha. All dose of fertilizer were applied before sowing.
Harvesting and threshing: Harvesting was done manually by using serrate edges sickles when the grains were dried enough, and awns colour had turned to straw colour. Harvesting of 1 m² of each plot were kept in different tagged plastic bags whereas total yield of plot was harvested ignoring first row from sides of the plot and also packed in another plastic bag. Harvested wheat was threshed on the floor by beating through sticks and hands.
Observations recorded
10 plants per genotype per replication were randomly selected except the boundary rows for data readings. The observations were taken for following parameters:-
Days to heading: The date of heading was recorded on all the plots when the 50% of the plants exposed their heads out from flag leaf sheath and it were converted to DAS.
Days to maturity: The maturity date was recorded when the 50% of the plants in the plot had their peduncle yellow and converted to days after sowing.
Plant height: It was measured from the soil surface in centimetre up to the height of the uppermost flag leaf angle spikelet at the time of harvesting.
Number of spikes/m2: Number of spikes per meter square were counted at the time of harvest and recorded.
Number of grains per spike: The number of grains in the main spike were counted at the time of harvest and recorded.
Grain yield: Grain yield per meter square were expressed in gram per plot and this value was converted to ton per hectare.
Thousand kernel weight (Test Weight): After harvesting,1000 seeds from each plot is randomly counted and weighted.
Statistical analysis
Data entry and processing was carried out using Microsoft Office Excel 2010. Analysis of variance of all the parameters and calculation of means was done by using R3.5.0 a software package for alpha lattice design by ADEL-R (CIMMYT Mexico).
Grain yield
There was highly significant (P<0.001) difference in grain yield for the genotypes in irrigated, drought and heat stress environments and highly significant in combined environment (Table 8). The mean grain yield for irrigated, drought and heat stress condition was 3328.02, 1435.93 and 1793.65 kg/ha respectively with the mean of 2186 kg/ha. Under normal irrigated condition, BL4708 highest mean yield with 3731.5 kg/ha and NL1328 yield lowest mean yield of 2653.25 kg/ha. In heat stress condition BL4699 had maximum mean yield of 2226.25 kg/ha and NL1307 had minimum mean yield of 1185 kg/ha. Similarly, in drought condition NL1327 had maximum mean yield of 2005.75 kg/ ha and NL1325 had minimum yield of 1042.5 kg/ha (Table 4, Figure 3).
| S.No | Genotype | Grain Yield (GY) | Days of Maturity (DOM) | ||||||
|---|---|---|---|---|---|---|---|---|---|
| Heat stress | Irrigated | Rainfed | Overall | Heat stress | Irrigated | Rainfed | Overall | ||
| 1 | NL_1326 | 2173.25 | 3101.75 | 1458.25 | 2226.649 | 97 | 113.75 | 103.25 | 105.0334 |
| 2 | NL_1244 | 1455.25 | 3034.75 | 1714 | 2108.318 | 99.75 | 115.5 | 112 | 108.9929 |
| 3 | NL_1202 | 1277 | 3603.25 | 1548.75 | 2316.001 | 100.5 | 116.25 | 109.5 | 108.4399 |
| 4 | BHRIKUTI | 2152.5 | 3516 | 1611 | 2336.557 | 99.25 | 112.75 | 109 | 107.1692 |
| 5 | RR_21 | 1720 | 3134.75 | 1179.5 | 2070.635 | 100.25 | 115 | 109.5 | 108.2044 |
| 6 | NL_1327 | 1641.5 | 3519.75 | 2005.75 | 2311.661 | 100.5 | 115.25 | 110.5 | 108.6939 |
| 7 | GAUTAM | 1796.75 | 3150 | 1372.5 | 2138.256 | 99.5 | 116 | 112 | 109.0378 |
| 8 | NL_1307 | 1185 | 3323.5 | 1385.75 | 2047.081 | 100.5 | 117.25 | 113.5 | 110.1694 |
| 9 | BL_4708 | 2110.5 | 3731.5 | 1473.75 | 2345.246 | 97 | 115.75 | 110 | 107.6194 |
| 10 | BL_4699 | 2226.25 | 3249.25 | 1591.75 | 2303.362 | 98.25 | 115.25 | 113 | 108.7519 |
| 11 | NL_1207 | 1277 | 3296.25 | 1308.25 | 2037.261 | 100.5 | 116.5 | 116.25 | 110.741 |
| 12 | NL_1211 | 1714.5 | 3596.75 | 1444.25 | 2231.743 | 100.25 | 116.25 | 111.5 | 109.251 |
| 13 | NL_1325 | 1830.25 | 3714.25 | 1042.5 | 2196.88 | 99.25 | 115.75 | 112.5 | 109.1368 |
| 14 | NL_1253 | 2038.75 | 3356.25 | 1459.5 | 2243.702 | 99.5 | 115.25 | 108 | 107.6914 |
| 15 | NL_1260 | 1805.25 | 3423.5 | 1163.75 | 2149.451 | 97.5 | 114 | 107.75 | 106.6124 |
| 16 | BL_4707 | 1813.5 | 3666 | 1293.75 | 2231.325 | 99.75 | 115 | 110.75 | 108.5002 |
| 17 | NL_1247 | 1798.25 | 2912.75 | 1409.5 | 2089.171 | 99 | 115.25 | 112 | 108.7709 |
| 18 | NL_1254 | 1274.75 | 3511.5 | 1377.5 | 2100.068 | 100.25 | 116.25 | 110.5 | 108.9676 |
| 19 | NL_1328 | 1707.5 | 2653.25 | 1307.5 | 1999.858 | 100.5 | 116.25 | 111.5 | 109.2195 |
| 20 | BL_4335 | 2147 | 3065.5 | 1541.25 | 2227.526 | 97 | 112.75 | 105.25 | 105.4136 |
| Mean | 1793.65 | 3328.025 | 1434.938 | 99.25 | 115.3 | 110.4125 | |||
| CV | 12.05939 | 7.686496 | 13.77501 | 0.71245 | 0.576392 | 1.057183 | |||
| M Serror | 46787.13 | 65438 | 39070.55 | 0.5 | 0.441667 | 1.3625 | |||
| LSD | 305.9446 | 361.8218 | 279.5789 | 1.000149 | 0.939998 | 1.651003 | |||
Table 4: Mean of Yield and yield attributing character of stress and non-stress condition.
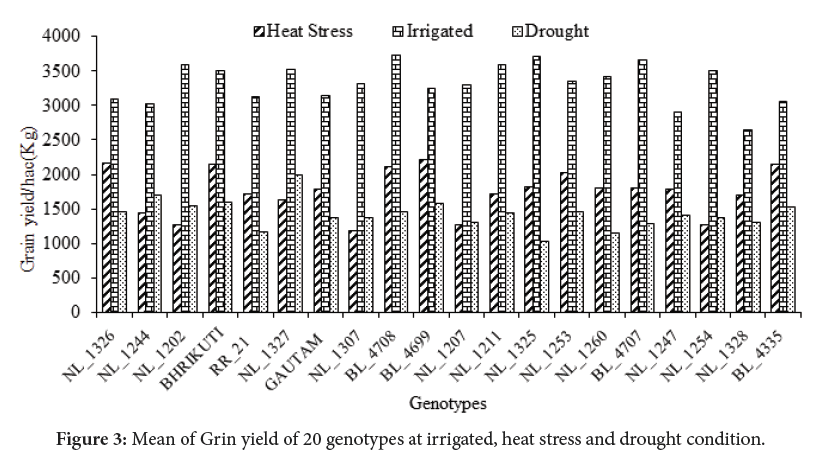
Figure 3. Mean of Grin yield of 20 genotypes at irrigated, heat stress and drought condition.
Days of Maturity (DOM)
There was highly significant (p<0.001) difference in days to maturity for the genotypes in irrigated, Drought and heat stress environments as well as in combined environment (Table 8). The mean number of days to maturity for irrigated, drought and heat stress condition was 115.3, 110.41 and 99.25 respectively with the mean of 108 days (Table 4). Under normal irrigated condition, BL4335 and Bhrikuti maturity was earliest with the mean of 112.75 days and NL1307 maturity was the last in 117.25 days. In Heat stress condition NL1326, BL4335 and BL4708 mature earliest with the mean of 97 days and NL1202, NL1327, NL1207 and NL1328 maturity was last in 100.5 days. Similarly in drought condition NL1326 matured earliest and it took 103.25 days while NL1207 took longest days of maturity i.e. 116.25 days (Figure 4).
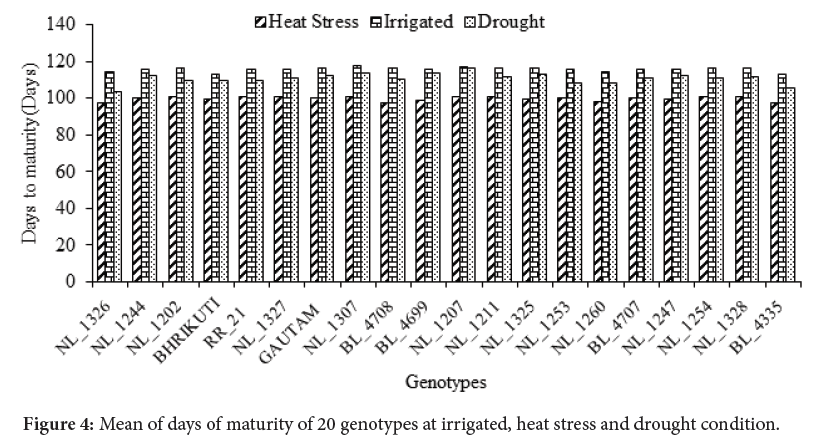
Figure 4. Mean of days of maturity of 20 genotypes at irrigated, heat stress and drought condition.
Days of heading
There was highly significant (P<0.001) difference in days to heading for the genotypes in irrigated, Drought and heat stress environments as well as in combined environment (Table 8). The mean number of days to heading for irrigated, drought and heat stress condition was 78.22, 76.58 and 60.8 respectively with the mean of 71.87 days (Table 5). Under normal irrigated condition, BL4335 heading was earliest with the mean of 73.5 days and NL1207 heading was the last in 81.5 days. In heat, stress condition NL1326 headed earliest with the mean of 57 days and BL4707 heading was last in 63.75 days. Similarly, in drought condition NL1326 headed earliest and it took 69 days while NL1207 took longest days of heading i.e. 84 days (Figure 5).
| S.No | Days of Heading (DOH) | Plant Height (PH) | |||||||
|---|---|---|---|---|---|---|---|---|---|
| Genotype | Heat stress | Irrigated | Rainfed | Overall | Heat stress | Irrigated | Rainfed | Overall | |
| 1 | NL_1326 | 57 | 75 | 69 | 67.31139 | 77.75 | 92.5 | 70 | 82.05085 |
| 2 | NL_1244 | 62 | 80.5 | 78.5 | 73.54815 | 80.75 | 94.5 | 67.75 | 83.26236 |
| 3 | NL_1202 | 61 | 80 | 75.75 | 72.24431 | 76.75 | 83.5 | 69.5 | 78.7652 |
| 4 | BHRIKUTI | 60 | 75 | 74.75 | 70.04978 | 78.75 | 77.25 | 70.5 | 77.13306 |
| 5 | RR_21 | 60 | 75.5 | 74.25 | 70.04081 | 84.25 | 91.75 | 69 | 83.82775 |
| 6 | NL_1327 | 62.75 | 78.5 | 76.5 | 72.54184 | 73.75 | 88.5 | 64.75 | 78.13137 |
| 7 | GAUTAM | 60.75 | 78 | 76.75 | 71.8254 | 87.5 | 91.5 | 69.75 | 85.01616 |
| 8 | NL_1307 | 61 | 79.75 | 80 | 73.45716 | 80.5 | 90 | 65 | 81.40575 |
| 9 | BL_4708 | 57.5 | 78 | 76.75 | 70.82216 | 79.5 | 94.75 | 71.25 | 83.40132 |
| 10 | BL_4699 | 60.25 | 79.25 | 78.75 | 72.6776 | 88.5 | 104.75 | 71.25 | 90.60529 |
| 11 | NL_1207 | 63.25 | 81.5 | 84 | 75.96543 | 77.5 | 87.5 | 68.5 | 79.93563 |
| 12 | NL_1211 | 63 | 80.25 | 78.25 | 73.71839 | 80.75 | 95.25 | 66.75 | 83.50217 |
| 13 | NL_1325 | 59.75 | 75.75 | 77.25 | 70.97529 | 74.75 | 84.25 | 62.5 | 76.74342 |
| 14 | NL_1253 | 60.5 | 76.25 | 72 | 69.73796 | 77.5 | 84 | 63.75 | 77.92917 |
| 15 | NL_1260 | 59.5 | 76 | 74.25 | 70.03973 | 76.25 | 91.5 | 67.75 | 80.57459 |
| 16 | BL_4707 | 63.75 | 79.5 | 78 | 73.63393 | 81.75 | 91.5 | 71 | 83.04383 |
| 17 | NL_1247 | 61 | 81 | 78 | 73.25522 | 81.25 | 86.75 | 68 | 80.82499 |
| 18 | NL_1254 | 62 | 80 | 74.75 | 72.22183 | 75.25 | 82.75 | 66 | 77.09012 |
| 19 | NL_1328 | 63.25 | 81.25 | 79.25 | 74.39337 | 78.5 | 81.75 | 68 | 78.13997 |
| 20 | BL_4335 | 58.5 | 73.5 | 74.75 | 69.12358 | 86.5 | 96.5 | 73.25 | 87.01699 |
| Mean | 60.8375 | 78.225 | 76.575 | 79.9 | 89.5375 | 68.2125 | |||
| CV | 1.633417 | 1.125396 | 1.379986 | 4.216491 | 3.846654 | 5.699073 | |||
| M Serror | 0.9875 | 0.775 | 1.116667 | 11.35 | 11.8625 | 15.1125 | |||
| LSD | 1.405556 | 1.245175 | 1.494657 | 4.765161 | 4.871557 | 5.498545 | |||
Table 5: Mean of days of heading and plant height of stress and non-stress condition.
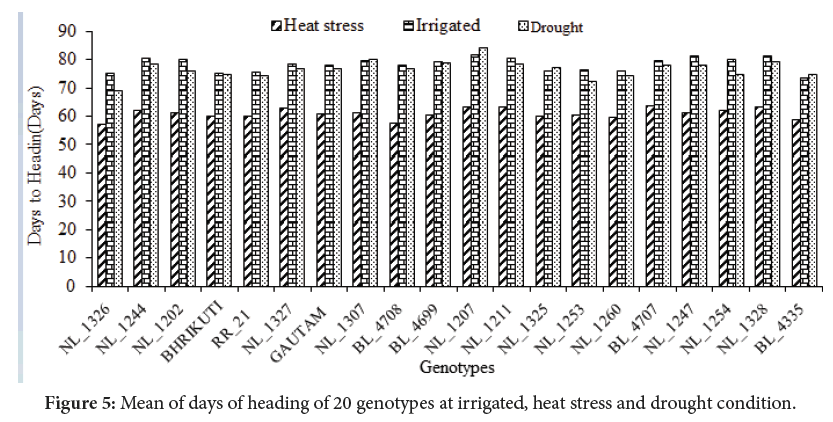
Figure 5. Mean of days of heading of 20 genotypes at irrigated, heat stress and drought condition.
Plant height
There was highly significant (P<0.001) difference in plant height for the genotypes in irrigated, drought and heat stress environments as well as in combined environment (Table 8). The mean plant height for irrigated, drought and heat stress condition was 89.53, 68.21 and 79.9 cm respectively with the mean of 81 cm (Table 5). Under normal irrigated condition, BL4699 highest mean plant height with 104.75 cm and Bhrikuti had lowest mean plant height of 77.25 cm. In Heat stress condition BL4699 had maximum mean plant height of 88.5 cm and NL1327 had minimum mean plant height of 73.75 cm. Similarly in Drought condition BL4335 had maximum mean plant height of 73.25 cm and NL1325 had minimum plant height of 62.5 cm (Figure 6).
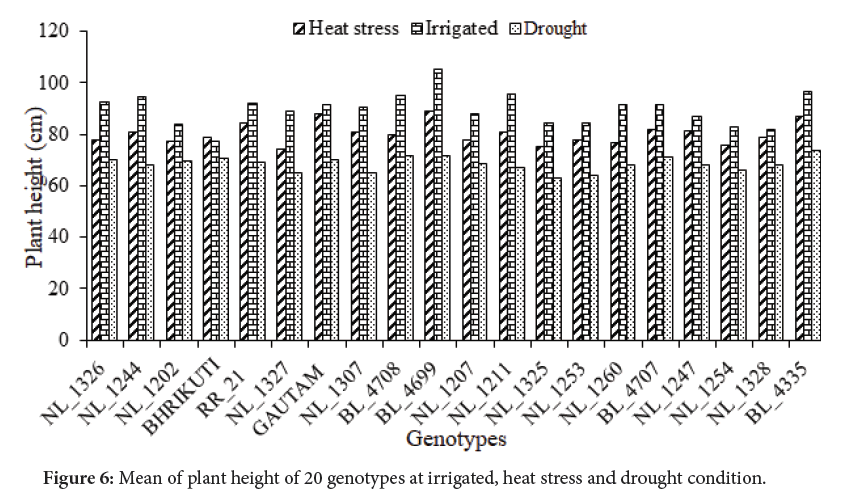
Figure 6. Mean of plant height of 20 genotypes at irrigated, heat stress and drought condition.
Spikes/m2
There was highly significant (P<0.001) difference in spike/m2 for the genotypes in irrigated, drought and heat stress environments as well as in combined environment (Table 8). The mean spike/ m2 for irrigated, drought and heat stress condition was 340.025, 226.11 and 262.73 respectively with the mean of 276.28. Under normal irrigated condition, NL1328 highest mean spike/m2 with 405.25 and BL4334 had lowest mean Spike/m2 of 29.75. In Heat stress condition BL4707 had maximum mean spike/m2 of 306.75 and NL1307 had minimum mean spike/m2 of 194.5. Similarly, in Rain fed condition NL1244 had maximum mean Spike/m2 of 278 and BL4335 had minimum Spike/m2 of 147 (Table 6 and Figure 7).
| S.No | Genotype | Number of Grain Per Spike (NGPS) | Spike per m2 | ||||||
|---|---|---|---|---|---|---|---|---|---|
| Heat stress | Irrigated | Rainfed | Overall | Heat stress | Irrigated | Rainfed | Overall | ||
| 1 | NL_1326 | 41.25 | 45.75 | 42.5 | 42.16573 | 293.75 | 371 | 263.25 | 299.9305 |
| 2 | NL_1244 | 40.25 | 42 | 46 | 41.83939 | 294.5 | 345.75 | 278 | 297.6106 |
| 3 | NL_1202 | 36.75 | 43.25 | 38.5 | 39.46497 | 232.75 | 312.5 | 251.75 | 268.5706 |
| 4 | BHRIKUTI | 40.75 | 43.75 | 39.25 | 40.74267 | 271.5 | 359 | 218.5 | 281.031 |
| 5 | RR_21 | 30.25 | 38.25 | 34.25 | 35.37705 | 236.75 | 313 | 187.75 | 254.2961 |
| 6 | NL_1327 | 36.5 | 53 | 40.25 | 42.19181 | 250.25 | 304.5 | 231.75 | 266.0531 |
| 7 | GAUTAM | 40.25 | 40.75 | 43.25 | 40.83569 | 241 | 360.25 | 257.25 | 283.3109 |
| 8 | NL_1307 | 51.5 | 39.25 | 37.75 | 41.96035 | 194.5 | 321 | 222.75 | 254.4889 |
| 9 | BL_4708 | 35 | 47 | 38.25 | 39.86756 | 233 | 357.25 | 260.25 | 281.3785 |
| 10 | BL_4699 | 39 | 44.75 | 33.5 | 39.07514 | 302 | 313.5 | 269.75 | 289.7132 |
| 11 | NL_1207 | 22 | 41.75 | 32.25 | 33.64593 | 272.5 | 332.25 | 203.75 | 271.3093 |
| 12 | NL_1211 | 41 | 43 | 31.25 | 38.55701 | 247.5 | 302 | 223.25 | 262.7338 |
| 13 | NL_1325 | 46 | 46.75 | 34.5 | 41.58869 | 275.5 | 357.5 | 222.5 | 282.5579 |
| 14 | NL_1253 | 39.5 | 47.5 | 35.25 | 40.35797 | 279.75 | 330.25 | 233 | 279.5933 |
| 15 | NL_1260 | 32 | 44.5 | 38 | 38.41576 | 242 | 345.5 | 224.5 | 272.1484 |
| 16 | BL_4707 | 32.5 | 45.25 | 35 | 37.91916 | 306.75 | 368.5 | 174.75 | 281.2656 |
| 17 | NL_1247 | 33.75 | 45.75 | 29.25 | 36.87483 | 296.75 | 358.75 | 213 | 285.702 |
| 18 | NL_1254 | 39.75 | 42 | 35.75 | 39.1077 | 271.75 | 350 | 224.75 | 280.4182 |
| 19 | NL_1328 | 31.75 | 35 | 35.25 | 35.14457 | 234.25 | 405.25 | 214.75 | 282.268 |
| 20 | BL_4335 | 30.25 | 37.25 | 33.75 | 34.95136 | 258 | 292.75 | 147 | 244.7866 |
| Mean | 37 | 43.325 | 36.6875 | 261.7375 | 340.025 | 226.1125 | |||
| CV | 10.40628 | 8.79417 | 8.731894 | 9.599415 | 6.136443 | 10.68074 | |||
| M Serror | 14.825 | 14.51667 | 10.2625 | 631.2792 | 435.3667 | 583.2458 | |||
| LSD | 5.445992 | 5.389061 | 4.531127 | 35.53779 | 29.51259 | 34.15903 | |||
Table 6: Mean on number of grains per spike and spike per m2 of stress and non-stress condition.
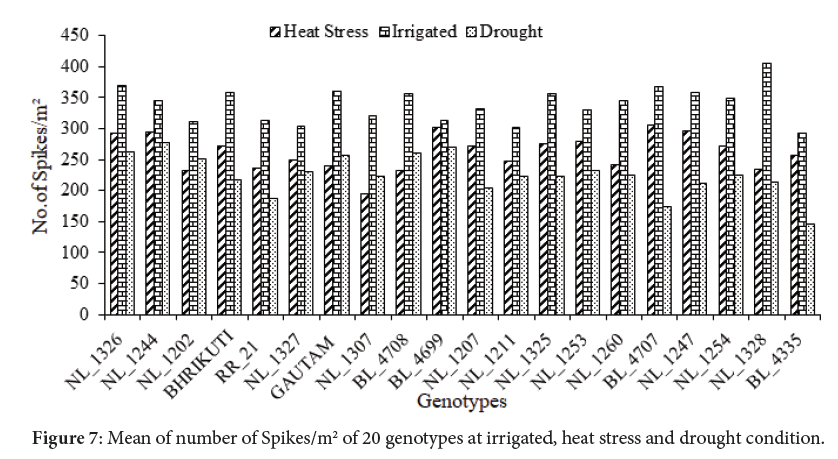
Figure 7. Mean of number of Spikes/m2 of 20 genotypes at irrigated, heat stress and drought condition.
Number of grain/spike (NGPS)
There was highly significant (p<0.001) difference in NGPS for the genotypes in irrigated, Drought and heat stress environments as well as in combined environment (Table 8). The mean NGPS for irrigated, drought and heat stress condition was 43.32, 36.68 and 37 respectively with the mean of 39. Under normal irrigated condition, NL1327 highest mean NGPS with 53 and NL1328 had lowest mean NGPS of 35. In Heat stress condition NL1307 had maximum mean NGPS of 51.5 and NL1207 had minimum mean NGPS of 22. Similarly in drought condition NL1244 had maximum mean NGPS of 46 and NL1247 had minimum NGPS of 29.25 (Table 6 and Figure 8).
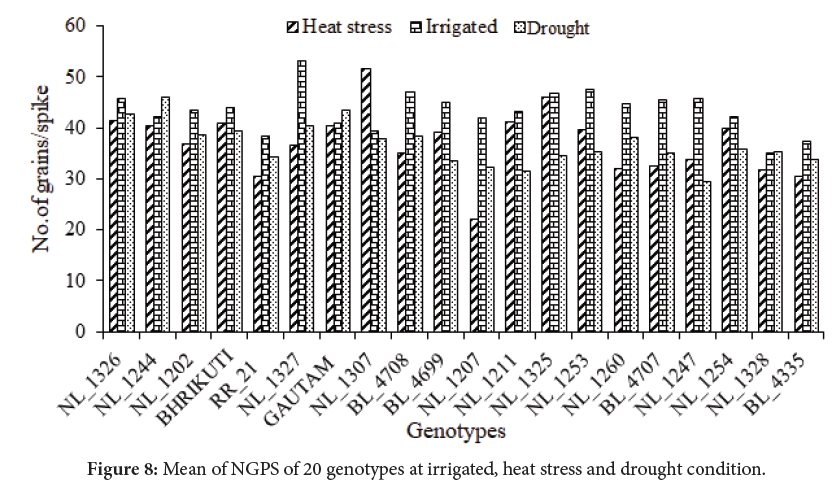
Figure 8. Mean of NGPS of 20 genotypes at irrigated, heat stress and drought condition.
Thousand Kernel Weight (TKW)
There was highly significant (p<0.001) difference in TKW for the genotypes in irrigated, Drought and heat stress environments as well as in combined environment (Table 8). The mean TKW for irrigated, drought and heat stress condition was 45.06, 40.25 and 36.025 g respectively with the mean 40.445 g. Under normal irrigated condition, BL4335 highest mean TKW with 52.25 g and NL1326 had lowest mean TKW of 38.75 g. In Heat stress condition BL4335 had maximum mean TKW of 47 gm and NL1244 had minimum mean TKW of 29.75 g. Similarly in Drought condition BL4335 had maximum mean TKW of 47.25 g and NL1244 had minimum TKW of 35 g (Table 7 and Figure 9).
| S.N | Genotype | Test Weight (TW) | |||
|---|---|---|---|---|---|
| Heat stress | Irrigated | Rainfed | Overall | ||
| 1 | NL_1326 | 33 | 38.75 | 36.75 | 36.33327 |
| 2 | NL_1244 | 29.75 | 41 | 35 | 35.45229 |
| 3 | NL_1202 | 41 | 47.25 | 40.5 | 42.82047 |
| 4 | BHRIKUTI | 33.75 | 40.25 | 38 | 37.45451 |
| 5 | RR_21 | 35 | 45.25 | 43.5 | 41.21869 |
| 6 | NL_1327 | 37.5 | 48.75 | 42 | 42.66029 |
| 7 | GAUTAM | 39.5 | 48.25 | 45 | 44.10189 |
| 8 | NL_1307 | 30.75 | 46.5 | 37.75 | 38.41558 |
| 9 | BL_4708 | 39.75 | 46.25 | 41.5 | 42.42003 |
| 10 | BL_4699 | 38.75 | 48.75 | 43.25 | 43.46118 |
| 11 | NL_1207 | 33 | 43 | 38 | 38.09522 |
| 12 | NL_1211 | 37.75 | 51.5 | 43.25 | 44.0218 |
| 13 | NL_1325 | 30.5 | 41.75 | 38.5 | 37.05407 |
| 14 | NL_1253 | 37 | 46.5 | 41.5 | 41.61914 |
| 15 | NL_1260 | 35 | 43 | 36.75 | 38.33549 |
| 16 | BL_4707 | 36 | 44.5 | 43 | 41.1386 |
| 17 | NL_1247 | 35 | 41 | 37.5 | 37.93505 |
| 18 | NL_1254 | 35 | 46.5 | 38.5 | 40.01736 |
| 19 | NL_1328 | 35.5 | 40.25 | 37.5 | 37.85496 |
| 20 | BL_4335 | 47 | 52.25 | 47.25 | 48.50678 |
| Mean | 36.025 | 45.0625 | 40.25 | ||
| CV | 2.645566 | 2.518015 | 2.913302 | ||
| M Serror | 0.908333 | 1.2875 | 1.375 | ||
| LSD | 1.348038 | 1.60492 | 1.658559 | ||
Table 7: Mean of test weight.
| Environment | Statistic | BLUP_DOH | BLUP_DOM | BLUP_PH | BLUP_Spike_m2 | BLUP_NGPS | BLUP_TKW | BLUP_Yield |
|---|---|---|---|---|---|---|---|---|
| overall | Heritability | 0.935465 | 0.895285 | 0.884571 | 0.718865 | 0.769388 | 0.961067 | 0.655449 |
| overall | Genotype Variance | 4.675694 | 2.238563 | 15.03176 | 281.7774 | 9.074181 | 11.32083 | 17970.08 |
| overall | GenxLoc Variance | 1.360223 | 1.246409 | 5.08645 | 321.5274 | 8.203266 | 2.007675 | 29707.01 |
| overall | Residual Variance | 1.150289 | 0.649135 | 9.442269 | 679.3246 | 16.23164 | 1.487939 | 53942.23 |
| overall | Grand Mean | 71.87917 | 108.3208 | 81.42 | 275.9583 | 39.00417 | 40.44583 | 2185.538 |
| overall | LSD | 1.09489 | 0.978424 | 2.819215 | 17.96603 | 2.936074 | 1.326456 | 161.1301 |
| overall | CV | 1.492109 | 0.743799 | 3.774045 | 9.444852 | 10.32928 | 3.015912 | 10.62689 |
| overall | n Replicates | 2 | 2 | 2 | 2 | 2 | 2 | 2 |
| overall | n Environments | 6 | 6 | 5 | 6 | 6 | 6 | 6 |
| overall | Genotype significance | 8.79E-21 | 4.42E-14 | 9.44E-12 | 5.35E-05 | 2.65E-06 | 6.96E-29 | 0.001312 |
| overall | GenxEnv significance | 1.20E-09 | 5.24E-14 | 0.000957 | 0.000714 | 0.000707 | 5.26E-11 | 0.000309 |
Table 8: Combined analysis of ANOVA by environment and year.
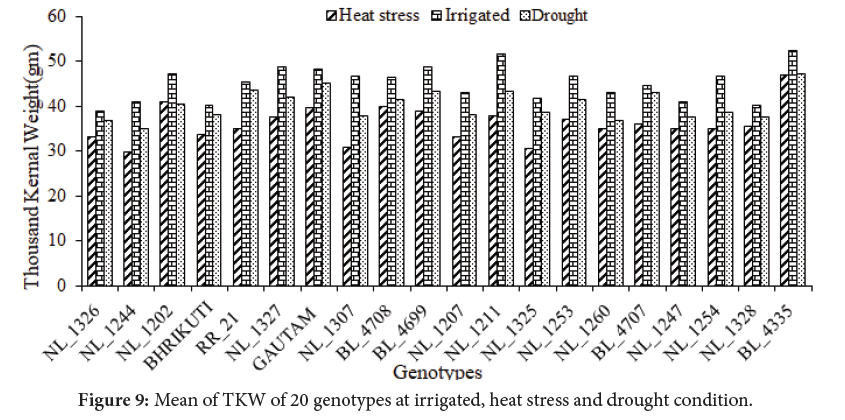
Figure 9. Mean of TKW of 20 genotypes at irrigated, heat stress and drought condition.
Yield attributing character
Highly Significant genotypic differences were observed for all agro-morphological traits which were in agreement with the findings by Singh et al. [15].
Days of Heading (DOH)
Significant reduction of DOH is due to heat stress condition is in agreement with the findings by Din et al., Mondini et al. [16,17]. It seems to be caused mainly due to the shortening of life cycle as a result of terminal heat stress associated with late planting.
The reduction of DOH also occurs at drought condition. Matching of the growth duration of plants to soil moisture availability is the critical to realize high seed yield [18]. Araus et al. reported that the drought escape occurs when phenological development is successfully matched with the periods of soil moisture availability and where crop growth season is shorter and terminal drought stress occurs [19]. High yields can be reached when the growth stages of booting and flowering, heading and milking are provided with sufficient quantities of water [20]. Selection of early maturing genotypes has been an effective strategy for minimizing the yield loss from terminal drought stress in which crop growth duration has been shortened.
Days to Maturity (DOM)
The highly significant (p<0.001) difference for days to maturity of genotypes in all environment suggested the genotypes were fall into different maturity group. Combined ANOVA revealed a significant effect of DOM. It had been confirmed with the findings of others. The interaction between genotype and environment was highly significant and it showed variability across environment. The reduction of days to maturity under heat stress condition is also reported by other scientist [21]. Heat stress ranging from 28°C to 30°C may alter the plant growth duration by reducing seed germination and maturity periods. Warm environment produces lower biomass compared to plants grown under optimum or low temperature. In wheat, grain-filling duration may be decreased by 8-12 days with the increase of 5°C temperature above 20°C [22]. The increase in night temperature is more responsive, shortens the grain-filling period, and reduces the grain yield than that of day temperature. Night temperatures of 20°C and 23°C reduced the grain-filling period by 3 to 7 days [23]. Recently, Song et al. observed a significant reduction in the rate of grain filling in wheat cultivars at day/night temperature of 32/22°C when compared with that of 25/15°C [24].
The decrease in maturity days under drought is controlled by the lower of nutrients in the plants which decreased chlorophyll in leaves due to the lack of nitrogen needed for the assimilation. The loss of the chloroplast integrity in the leaf causes the early senescence in drought that ultimately leads plant to mature early. It is generally known that the duration of maturity of wheat crop is reduced by delayed planting than the optimum time. Wheat grown under heat stress conditions is exposed to low temperature up to booting stage, but the later stages face higher temperature that inhibits grain development, resulting into poor grain yield [15]. In wheat, period from onset of spike ignition to flowering is very sensitive to temperature acceleration and it seems to be the main reason for reduction in sink size under high temperature conditions. Delayed planting affects the production of wheat by causing reduction in duration of grain filling phase, kernel size, biomass, tiller number, etc.
Plant height
Delayed planting significantly reduced plant height, days to heading and maturity. This is in agreement with the findings by Singh et al. [15]. It seems to be caused mainly due to the shortening of life cycle as a result of terminal heat stress associated with late planting. Decrease in plant height in late sown condition might be due to increased air temperature in vegetative stage of late sown wheat. Increased air temperature stops vegetative development and shortens the size of the organ developed [25]. The averages reduction of plant height at heat stress condition is 25.8% in wheat [26].
Highly significant (p≤0.01) differences among the genotypes for plant height showing variation in plant height were in agreement with the findings of Rafiullah et al. The decrease in plant height of all genotypes in drought condition in comparison to irrigated condition may be due to decrease in relative turgidity and dehydration of protoplasm which is associated with a loss of and reduced expansion of cell and cell division. The reduction in plant height under water stress condition could be attributed to decline in cell enlargement and more leaf senescence [27]. These results are similar with findings of Bayoumi et al. [28] who had observed significant reduction in plant height under drought stress condition. Optimum plant height is require for better yield in wheat as tall plants are susceptible to lodging and excessively short plants are associated with a yield loss in a drought environment. Rebetzke et al. reported that the dwarfing genes Rht-D1b and Rht-B1b are sensitive to gibberellic acid have increase yield in irrigated condition through reduction in lodging and increased grain number [29]. Current research papers conclude drought has bearing on plant height. Well irrigated varieties are taller than plants under drought stress condition. Furthermore, tall genotypes resulted greater decrease in yield than dwarfish genotypes under drought conditions.
Number of grains per spike and number of spike/m2
Highly significant (p<0.001) differences among genotypes for number of grains per spike and number of spike/m2 indicated variation among genotypes confirmed with the findings of Ahmad et al. [29].
The number of spikes/m2 decrease at heat stress condition. Delayed emergence of seedlings caused by low temperature and early maturity due to high temperature during reproductive stage particularly the grain filling process, leads to reduced number of effective spikes per m2 [30]. Temperatures above 20°C between spike initiation and anthesis speed up the development of the spike but reduce the number of spikelets and grains per spike [31]. Heat stress adversely affects pollen cell and microspore resulting into male sterility [32]. Even high temperature of above 30°C during floret development may cause complete sterility in wheat depending on genotypes. In wheat, the anther produced under 3 days heat stress during anthesis was found to be structurally abnormal and nonfunctional florets [33].
In drought condition, stress causes sterile pollen, disruption of current photosynthesis and transfer of stored food material to the grains which may cause reduction in grain number in spike and finally leads to decrease in No. of spike/m2. Similar result of 48% reduction in grain number per head was reported by Giuanta et al. Moisture stress before pollen (stage between stem elongation and pollen) reduced the number of grains per spike than in irrigated condition was reported by Fischer et al. [34]. In addition, there are some evidences that the amount of dry material and more important the amount of nitrogen on spike at the time of pollination is an important component for determining the grain number in spike.
Thousand Grain Weight (TGW)
Highly significant difference (p<0.001) in thousand grain weight for genotypes indicates the variability among genotypes revealed with findings of Nasier. Islam et al., Mohammed et al. [35,36]. Heat stress caused significantly reduction of TKW which was also reported by Kumar and Sharma. [37].
Decrease in thousand grain weight under drought stress condition was reported by Kilic et al. [38]. The decrease in thousand grain weight may be due distributed nutrient uptake efficiency and photosynthetic translocation within the plant that produced shriveled grains due to hastened maturity. This is possible due to the shortage of moisture which forces plant to complete its grain formation in relatively lesser time. Reduction in grain weight potential as indirect selection criteria for grain under drought condition had identified by Sharma et al. [39]. Grain weight is a function of grain length and width. Ji et al. reported the critical period of grain weight determination which starts shortly before anthesis and continues throughout the grain filling duration determines the final grain size in wheat [40]. Thus, drought stress during grain-filling period reduces grain weight significantly. Similarly, in heat stress condition, wheat sowing significantly reduced TKW which was also reported by Kumar and Sharma [37].
Grain yield
It is generally known that the duration of maturity of any crop is reduced by delayed planting than the optimum time. Wheat grown under heat stress conditions is exposed to low temperature up to booting stage, but the later stages face higher temperature that inhibits grain development, resulting into poor grain yield [15]. In wheat, period from onset of spike ignition to flowering is very sensitive to temperature acceleration and it seems to be the main reason for reduction in sink size under high temperature conditions. Heat stress affects the production of wheat by causing reduction in duration of grain filling phase, kernel size, biomass, tiller number, etc. Heat stress adversely affected days to appearance of first node, tiller per plant and spikelets per plant, thereby resulting in reduction of sink capacity and future sources capability of the plant [41]. Asif et al., Ahmad et al. reported highly significant (p≤0.001) differences in genotypes showing variation for grain yield which confirms with our findings [29,42]. Khamssi reported the similar findings [43]. Decrease in grain yield under drought condition was reported by many researches [44,45]. Grain yield was greater in irrigated condition than in drought and heat stress environment as a consequence of more spikes per square meter, heavier grains, and a longer plant cycle. Significant reduction in grain yield due to post anthesis water stress may result from a reduction of production of photo-assmilates (source limitation), power of the sink to absorb photo-assimilates and the grain filling duration. Kazmi et al. reported the severe reduction in grain yield with 40% reduction at three irrigation stage to 98% in the post anthesis indicates that the sensitivity of grain yield to drought stress depends upon the severity of the stress and the stage in which the drought condition was imposed [46]. Drought stress reduced the number of grains/spike and grain yield and the genotypes with more number of grains per ear produce more yields [47,48]. The improvement of cultivar yield under drought stress condition has resulted from a prolonged grain filling period, high chlorophyll content, a more sustained turgor or combination of them was reported by Paknejad et al. [49]. The varietal differences among wheat cultivars and their response to varying production environment have been studied for years by plant breeders and crop scientists. The topics have been more relevant in recent times, because of the increasing wheat demand for food and food-processing industry as a result of increasing world population, and production challenges due to changing climatic conditions [50,51]. Exposure of wheat crop to different biotic and abiotic stresses has been reported to adversely affect the growth and development of the crop, grain yield and quality. In the warm humid wheat production areas of Indo-Gangatic Plains that also includes the major wheat growing areas of Nepal, heat stress combined with drought, especially in the case of delayed sown crop has been projected as a major wheat production constraint [4]. Therefore, wheat varieties with enhanced heat and drought tolerance will be instrumental for mitigating yield losses in these areas.
The field research was conducted at the Bhairahawa in 2016/17 and 2017/18 in order to determine the physio-morphological and yield potential traits associated with heat and drought tolerance in wheat genotypes. Cultivars, moisture, temperature condition, growth and development are the crucial factors for successful wheat production. The rising world population and predicted change in future climatic conditions prevails the identification and selection of wheat genotypes that are adapted to stress conditions over diverse range of environments. Drought and heat stress are the major problem in wheat production in many parts of the world including Nepal. Both stresses are most common environmental stresses which affect the plant production through the alteration in plant metabolism and gene expression. Abiotic stresses are major challenge to agriculture scientists and plant breeders despite in the present scenario for the wheat production despite of many decades of research. It is the major constraint to the wheat production in many developing countries of the world and occasional causes of loss of agricultural production in many developed ones. Drought stress may occur at any time during the wheat growing season i.e. early or late however severe yield reduction occurs after anthesis. The amount and distribution of rainfall during the wheat growing season influence the variability in yield from year to year and from location to location. It is necessary to improve productivity of wheat under rainfed and dry conditions in Nepal through breeding of drought tolerant cultivars with high yield in order to solve the problems of food security. Late sowing of wheat is major reason for low grain production. In Nepal, wheat is mostly sown after the harvesting of paddy which pushes back the appropriate sowing time of wheat resulting in higher temperature stress during the grain filling period as a result yield of wheat is very poor.
The authors gratefully express their appreciations to the University Grant Commission, Nepal (Award No.: PhD 74_75/Ag & F-1) for providing financial support for this research project.
Received: 07-Jan-2020 Published: 23-Jan-2020, DOI: 10.35248/2322-3308.20.9.212
Copyright: © 2020 Poudel MR, et al. This is an open access paper distributed under the Creative Commons Attribution License. Journal of Biology and Today's World is published by Lexis Publisher.
Sources of funding : The authors gratefully express their appreciations to the University Grant Commission, Nepal (Award No.: PhD 74_75/Ag & F-1) for providing financial support for this research project.