Research Article - (2021) Volume 10, Issue 4
Background: A recent study was conducted to evaluate tree volume, biomass, and carbon stock in Java, Special Region of Yogyakarta, Indonesia in the mixed plantation of Artocarpus heterophyllus. Forest acts as a source or sinks for atmospheric CO2 to catches from the atmosphere in different carbon pools by trees in a forest. It was improperly managed and Illegal activities were done.
Methods: Sample trees were selected by a simple random sampling method in the study site and the elevation was recorded by GPS. Each sample tree height, diameter at (DBH) point, and crown cover were measured as a source of primary source data. Data were analyzed statistically and results were composed in excel, Sigma Plot, and Past software.
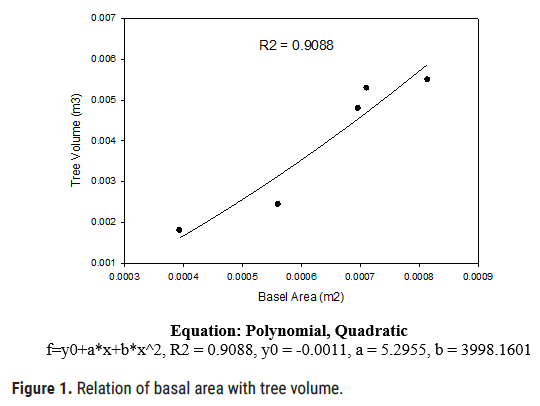
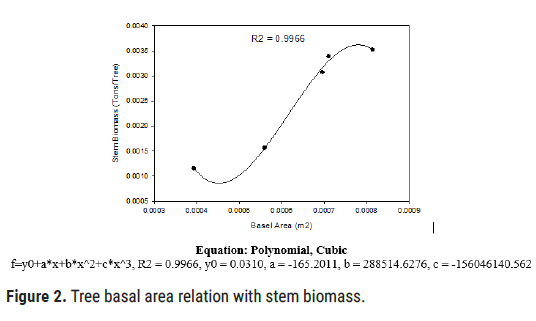
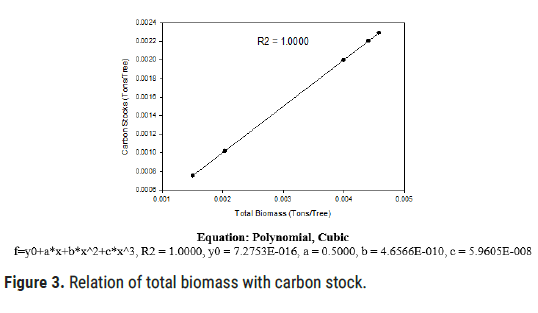
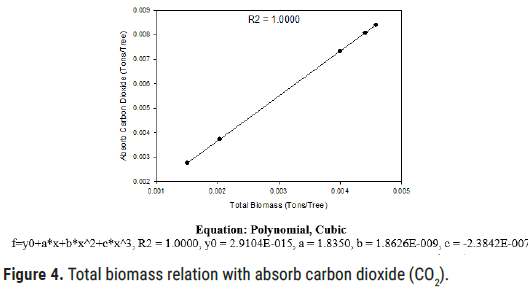
Results: The results of the conducted study are, average tree basel area was 0.00063 ± 0.00016 m2, while tree volume was 0.0039 ± 0.0017 m3, although the average total tree biomass was 0.0033 ± 0.0014 tons. Still, the mean carbon stock was 0.0016 ± 0.00071 tons, and the average absorb CO2 was 0.0060 ± 0.0026 tons. The results also concluded, tree basel areas have a strong positive correlation with tree volume, the value of R2 is 0.9088, while for stem biomass and R2 value is 0.9966. The correlation of total biomass with a carbon stock and R2 is 1.000 while the correlation with absorbing carbon dioxide and R2 is 1.000.
Objectives: Aims of the study to estimate the volume, stem, and total biomass, carbon stock, and absorb carbon dioxide and to expose the impact of basal area on tree volume and stem biomass and total biomass on carbon stocks and absorb carbon dioxide. The study concluded that it is needed to have Proper scientific management and proper utilization it can be significant measures to enhance the potential to stored and sink more carbon and control illegal activities.
Carbon stock • Stem and total biomass • Volume and basel area
Carbon occurs in the earth’s atmosphere as gas-carbon dioxide. It founds a very small percentage of the atmosphere about 0.04% approximately. However, it plays an important role in supporting life on earth, as plants make themselves from it. During photosynthesis, plants take carbon dioxide from the atmosphere, converting it into carbohydrates and releasing oxygen into the atmosphere. When these plants or trees die or burnt, the carbon stored in them is released back into the atmosphere [1]. Among the greenhouse gases, carbon dioxide is the most important gas that is caused by the activities and increases the cause of climate change [2]. Global climate change is the important issue among the scientific community because of accelerating carbon dioxide concentration in the atmosphere due to different human activities [3]. The greenhouse gases trap the heat in the atmosphere, which keeps the surface of the earth warmer. When greenhouse gases increase in quantity, they intensify the greenhouse effect that causes climate change [4]. Many human activities like land-use change, fossil fuel burning, and deforestation increase the concentration of carbon dioxide in the atmosphere and cause the problem of climate change. The IPCC in its fourth assessment report recommended for serious measures to check the problem of global warming to coup the serious ecological, social, and economic consequences [5].
Among the terrestrial ecosystem, the forest ecosystem has the significant potential to store and sink carbon and therefore globally forest is considered a potential tool to mitigate global climate change [6]. Carbon sequestration through forest growth provides a low-cost approach for meeting state and national goals to reduce net accumulations of atmospheric carbon dioxide. In forest ecosystem carbon stocks include "pools" in live trees, dead trees, understory vegetation on forest floor, soil carbon present in litter. Determining the level of carbon stocks in forest ecosystems has become a concern of governments, businesses, and many organizations [7]. Forest ecosystem stores 20%-50% more carbon as compared to other ecosystems due to its woody character and long-life span [8]. Being a participant of the Kyoto Protocol, they store carbon in the different forest types of Pakistan will be evaluated. In Pakistan, the forest department conducts inventory on regular basis for the measurement of the growing stock in the shape of a working plan and can be used to assessed to estimated carbon stock [9].
The Objectives of the study were to evaluate tree volume, stem, and total biomass, carbon stock and absorb carbon dioxide (CO2) in sample trees, to expose the correlation of basel area with tree volume, stem biomass and total biomass impacts on carbon stocks and absorb carbon dioxide in Artocarpus heterophyllus. The study provides detailed information and field protocol regarding biomass and carbon stock in the Artocarpus heterophyllus tree.
Research site
The research was conducted in in Java, Special Region of Yogyakarta, Indonesia in the mixed plantation of Artocarpus heterophyllus. The study site has mixed irrigated plantation of Artocarpus heterophyllus and the soil is generally fertile and favorable for forestry and agriculture practices. The elevation of the study site was 146 meters (70°46.1 S and 1100°23.13 E). The mean annual temperate was 25°C while the maximum temperatures of 30°C and the minimum was 20°C respectively were recorded. The study site is located in the center of Yogyakarta city. The area receives 2184 to 2000 mm annually average precipitation was also recorded by a metrological station in Yogyakarta city [10].
Research design
The researcher visited for the collection data to Java, Special Region of Yogyakarta, Indonesia in the mixed plantation of Artocarpus heterophyllus. In the study site, sample trees were selected by simple random sampling method. Each sample tree height was measured by climbing, using Abnize level, Haga altimeter, and Spiegel Relaskope, while diameter at (DBH) point was measured by using diameter tape, and the crown cover was also measured by using measuring tape of the sample trees. The diameter was measured at two different points diameters at breast height point and diameter at mid-point. GPS was used for taking the location and to find out the elevation of the site. Diameter at the midpoint were measured by climbed the tree by using diameter tape and calipers.
Measurement tree volume
Diameter at breast height was measured for tree cylindrical volume estimation and diameter at midpoint was measured for actual volume evaluation. To calculate stem volume (m3), tree height (m), basel area (m2), and diameter of the tree (cm) at DBH were measured. The height of the tree was measured by Abney’s level. The tree diameter was measured by Caliper. Basel area was calculated from DBH point and the following formula was used to find out stem and tree volume.
B.A=1/4 π D2
Tree volume was calculated by the following formula
V (m3/tree)=1/4 π D2 × H × FF
Whereas V=Volume of the stem, H=Height of tree, B.A=Cross-sectional Basel Area at DBH point and FF=Form Factor. For the present study, the form factor for each tree in the respective diameter class was calculated.
Calculation of stem and total biomass
Biomass of stem (tons/tree) was estimated from (BWD) basic wood density (kg m3) and volume (m3/tree). The value of (BWD) was taken from the literature [11]. To find out stem biomass, the formula used was:
Biomass of stem (tons/tree)=Volume of the stem (m3) × Basic wood density (kg m3).
Measurement of total biomass was done by using the biomass expansion factor. The biomass expansion factor is the ratio between stem biomass and total biomass. It means the contribution in making the total biomass of a tree by different parts of the tree i.e., leaves, root, stem, and twigs, etc. To calculate the total biomass, the stem biomass is multiplied with the BEF [12]. The formula used for that is given as under:
The Biomass Expansion Factor (BEF) was taken from available literature 1.51. The biomass of the other three components (leaves, branches, and roots) were estimated from stem biomass using published Biomass Expansion Factors (BEF) for this tree species [13].
Total biomass (tons/tree)=BEF × stem biomass (tons/tree)
Estimation of carbon stock
Estimation of total carbon stock, we used a conversion factor 0.5. We multiplied the conversion factor with total biomass. This conversion factor is used internationally, to estimate the total carbon stock, and the following formula was used. The conversion factor has been globally used by Ali, et al. and the formula is under given below [14].
Total carbon stock (tons/tree)=Conversion factor (0.5) × Total biomass (tons/tree)
Estimation of absor bing carbon dioxide
The total absorbs carbon dioxide of the sampled trees was calculated from the value of total carbon stock with the atomic mass of carbon dioxide (3.67) as it was taken from the literature and the following formula was used which are given below [15].
Absorb carbon dioxide (CO2) (tons/tree)=Total carbon stock (ton/tree) × Atomic mass of carbon dioxide (3.67).
Statistical analysis
To analyzed statistically, the primary data were analyzed in Microsoft, Excel and different formulas were used to find out the results of tree parameters basel area, volume, biomass, and carbon stock. The statistics univariates were used in Past software to find out the Mean, SD, CV (%) for tree volume and basal area, stem and total biomass, carbon stocks and absorb carbon dioxide (CO2). Regression models (Simple linear regression model) were applied in Sigma Plot version 10.0 for the correlation to expose the impacts of tree basel area on tree volume, stem and total biomass on carbon stock and absorb carbon dioxide and tables were formed in Excel [16-19].
The results of the conducted study were found of the Basal area, volume, stem and total biomass, carbon stock and absorb carbon dioxide of trees. The minimum basal areas were 0.000393 m2 calculated in sample tree number 1, while the maximum basal area was 0.000814 m2 in sample tree number 5 because the size of the diameter, sample tree no 5 is larger than 1 which are given in Table 1. Although the mean basal area was 0.000635 ± 0.000162 m2 and the sum of the total basal areas of all sample trees was 0.003174 m2 estimated. The standard deviation was 0.000162 and the coefficient variance was 25.58% estimated for basal area are shown in Table 2.
| Number of trees | Basal area | Tree volume | Stem biomass |
|---|---|---|---|
| M2/tree | M3/tree | Tons/tree | |
| 1 | 0.000393 | 0.001809 | 0.001158 |
| 2 | 0.00056 | 0.002448 | 0.001566 |
| 3 | 0.000696 | 0.004801 | 0.003073 |
| 4 | 0.000711 | 0.005296 | 0.00339 |
| 5 | 0.000814 | 0.005504 | 0.003523 |
Table 1. Basal area relation with tree volume, stem biomass/tree.
| Variables statistics | Basal area M2/tree | Tree volume M3/tree | Stem biomass tons/tree |
|---|---|---|---|
| Min | 0.000393 | 0.001809 | 0.001158 |
| Max | 0.000814 | 0.005504 | 0.003523 |
| Mean | 0.000635 | 0.003972 | 0.002542 |
| Sum | 0.003174 | 0.019858 | 0.012709 |
| SD | 0.000162 | 0.001717 | 0.001099 |
| CV (%) | 25.58643 | 43.22941 | 43.22942 |
Table 2. Statistics of Basal area, tree volume, and stem biomass.
The average tree volume of sample trees was 0.003972 ± 0.001717 m3 while the sum of all trees volume was 0.019858 m3. The minimum volume was 0.001809 m3 in tree number 1 while the maximum was 0.005504 m3 estimated in tree number 5, it’s because of the size of girth is bigger tree number 5 than tree number 1. The value of standard deviation was 0.001717 while the coefficient variance was 43.22% estimated for tree volume are shown in Table 2.
The minimum stem biomass was 0.001158 tons/tree in tree number 1 while the maximum was 0.003523 tons/tree in tree number 5 because of its size of diameter. The average stem biomass of all sample trees was 0.012709 ± 0.001099 tons/tree while the sum of the total stem biomass of all sample trees was 0.12709 tons estimated. The standard deviation was 0.001099 while the coefficient variance was 43.22% estimated which are shown in Table 3.
| Number of trees | Total biomass tons/tree |
Carbon sock tons/tree |
Absorb carbon dioxide tons/tree |
|---|---|---|---|
| 1 | 0.001505 | 0.000753 | 0.002762 |
| 2 | 0.002036 | 0.001018 | 0.003737 |
| 3 | 0.003995 | 0.001997 | 0.00733 |
| 4 | 0.004407 | 0.002203 | 0.008086 |
| 5 | 0.004579 | 0.00229 | 0.008403 |
Table 3. Total biomass relation carbon stock and absorb carbon dioxide/tree.
The minimum total biomass was 0.001505 tons/tree in tree number 1 while the maximum was 0.004579 tons/tree estimated in tree number 5 because of its size of diameter. The average total biomass was 0.003304 ± 0.001428 tons/tree for all sample trees while the sum of the total biomass was 0.016522 tons estimated. The standard deviation for total biomass was 0.001428 while the coefficient variance was 43.22% estimated which are given in Table 4.
| Variables statistics | Total biomass tons/tree | Carbon stock tons/tree | Absorb CO2 tons/tree |
|---|---|---|---|
| Min | 0.001505 | 0.000753 | 0.002762 |
| Max | 0.004579 | 0.00229 | 0.008403 |
| Mean | 0.003304 | 0.001652 | 0.006064 |
| Sum | 0.016522 | 0.008261 | 0.030318 |
| SD | 0.001428 | 0.000714 | 0.002621 |
| CV (%) | 43.2294 | 43.22943 | 43.22941 |
Table 4. Total biomass relation with carbon stock and absorb carbon dioxide.
The maximum carbon stock was 0.00229 tons/tree in tree number 5, while the minimum was 0.000753 tons/tree in tree number 1. The sum of the total carbon stock was 0.008261 tons while the average total carbon stock was 0.001652 ± 0.000714 tons estimated. The standard deviation was 0.000714 while the coefficient variance was 43.22% estimated for carbon stock which is shown in Table 4.
The average absorbed carbon dioxide was 0.006064 ± 0.002621 ton for all sample trees while the sum of the total absorb carbon dioxide content was 0.030318 tons estimated. The minimum absorbs carbon dioxide content was 0.002762 tons/tree in tree number 1 while the maximum was 0.008403 tons/tree estimated in tree number 5 because of its size of diameter. The standard deviation was 0.002621 and coefficient variance was 43.22% estimated to absorb carbon dioxide which is mention in Table 4.
The tree basal area shows a strong positive correlation with tree volume and the value of R2 is 0.9088 which is shown in Figure 1, while the basal area also shows a strong positive correlation with volume and R2 value is 0.9966 shown in Figure 2. Total biomass expresses a strong positive correlation on carbon stocks and the R2 value is 1.0 which is given in Figure 3 although total biomass also shows a very strong positive correlation with absorb carbon dioxide from the atmosphere by a tree in the study site and value of R2 is 1.0 shown in Figure 4.

Figure 1: Relation of basal area with tree volume.

Figure 2: Tree basal area relation with stem biomass.

Figure 3: Relation of total biomass with carbon stock.

Figure 4: Total biomass relation with absorb carbon dioxide (CO2).
Figure 1 describes the strong positive correlation of tree basal area with volume and stem biomass by using Equation: Polynomial, quadratic in simple linear regression model. While for total biomass correlation with carbon stocks and absorb carbon dioxide by using the equation: Polynomial cubic in regression model shown in Figure 2. The results of the recent study concluded that when the basal area is increases with an increase of tree volume and stem biomass and total biomass increases with the increase of carbon stock and absorbs carbon dioxide which are given in Table 1.
Figure 3 describes the strong positive correlation of tree stem biomass with total carbon stocks by using Equation: Polynomial, quadratic in simple linear regression model. While for total biomass correlation with absorb carbon dioxide by using the equation: Polynomial cubic in regression model shown in Figure 4.
Tree Basal area, volume, and stem biomass of sample tree number 1 were less than tree number 2 while tree number 3 is greater the tree number 2 but smaller than tree number 1. Tree number 4 is also greater than tree number 3 but smaller than tree number 5, the tree number 3 is smaller than tree number 4. Sample tree number 5 is also bigger than sample tree number 4 which shows the correlation of basel area with tree volume and stem biomass are given in Table 1.
Total tree biomass, total carbon stock, and total absorb carbon dioxide of sample tree number 1 was less than sample tree number 2 while sample tree number 3 is greater than tree number 2 but smaller than sample tree number one. Sample tree number fourth is also greater than tree number 3 but smaller than tree number 5, the tree number 3 is smaller than tree number 4, and the tree number 5 is also bigger than tree number 4 which shows a correlation of total biomass with total carbon stocks and absorb carbon dioxide absorb by sample trees from the atmosphere by the process of photosynthesis in the presences of sunlight are given in Table 4.
The research was conducted in Java, Special Region of Yogyakarta, Indonesia in the mixed plantation of Artocarpus heterophyllus. The objectives of the study were to estimate the tree basel area, stem, and total biomass, carbon stocks and absorb carbon dioxide. The results of the study concluded that tree basel area showed a strong positive correlation on tree volume and stem biomass when basal area was increases with an increase in volume and stem biomass of sample trees. As same total biomass has a strong positive correlation with carbon stocks and absorbs carbon dioxide and the value of R2 is very close to 1 which is shown in figures. Mixed plantation of Artocarpus heterophyllus is a valuable sink for carbon sequestration. Illegal activities were carried out and improper utilization and unscientific management plan and its needs the proper scientific management plan and proper utilization. By rehabilitation of degraded forest stand, afforestation, and reforestation can increase the potential of the mixed plantation of Artocarpus heterophyllus to sorted more carbon from the atmosphere and acts as a sink for carbon.
Citation: Sajad, et al. Method to Estimate above Ground Biomass and Carbon Stock of Artocarpus heterophyllus in Java, Special Region of Yogyakarta, Indonesia. J Biol Today's World, 2021, 10(5), 001-004.
Received: 09-Jun-2021 Published: 30-Jun-2021, DOI: 10.35248/2322-3308.21.10.014
Copyright: © 2021 Sajad, et al. This is an open-access article distributed under the terms of the Creative Commons Attribution License, which permits unrestricted use, distribution, and reproduction in any medium, provided the original author and source are credited.