Research - (2020) Volume 9, Issue 8
Introduction: Obesity has become a large health problem globally and a major risk factor contributing to a number of diseases. It is suggested in Saudi Arabia for obese adults to use Orlistat and Metformin; in addition to dieting and doing physical activity. However, there are limited studies on the regular practices of weight-loss among Saudi people especially with the aid of weight lowering medication.
Objectives: The aims of this study are to evaluate the practice of using weight lowering medications and to describe self-reported side effects of using these medications among Saudi females.
Methods: A cross-sectional study carried out on Saudi females whom were approached to answer a set of self-administered questionnaires. The survey covers several aspects that will aid the study’s topic such as the demographic data, previous or current use of weight loss medication and any side effects from using the medication. The collected data were then analyzed using SPSS program.
Results: There were 820 participants (647 electronic submissions and 173 by paper). The results showed that among them 21.3% were using weight lowering medication, while dieting and exercising were the main methods used to lose weight (64.1% and 61.5% respectively). In addition, the most common drug used for losing weight was Orlistat (26.4%). Furthermore, the most frequent self-reported side effect for using these kinds of drugs was oily spotting (25.9%).
Interpretation and conclusion: Saudi females were found to use weight lowering medications and it was related to several factors such as the BMI and the ages of participants, however dieting and exercising were the main methods reported for weight loss.
Weight loss • Obesity • Medication • Saudi female.
Obesity has become a large health problem globally and a major risk factor for number of diseases [1]. Saudi Arabia has a high percentage of overweight patients according to a study conducted in 2013. It showed that over 3.6 million (28.7% of population) Saudi adult were obese. Prevalence of obesity in women was 33.5% while for men it was 24.1% [2].
In 2015, the guidelines provided by the Ministry of Health for obesity management suggested obese adults to use Orlistat and Metformin as conditional recommendations in addition to dieting and physical activity, although in many countries, including Saudi Arabia, metformin use for weight loss is considered off-label [3]. Inclusion of other drugs that have been approved by US Food and Drug Administration (FDA) will be postponed due to the lack of data of their usage specifically in Saudi Arabia. There are limited studies on regular practices of weight-loss among Saudis especially with the aid of weight lowering medication. Therefore, we will conduct a cross-sectional study by distributing self-administered questionnaires to Saudi females in multiple setting. The survey will include questions concerning previous or current use of weight-reducing drugs and whether they suffered from any side effects from these drugs.
The purpose of this study is to estimate the prevalence of using medication for weight loss among Saudi females, given that obesity is significantly more common among females in Saudi Arabia [2,4]. We aimed to estimate the prevalence of using weight lowering medications among Saudi females, determine the most common types of medication used for weight loss, determine the most frequently self-reported side effects caused by weight lowering drugs, assess the attitude, awareness and knowledge toward using weight lowering medication among Saudi females and investigate the associations between using weight lowering medication and other factors such as age, marital status, educational level, income, and body mass index. We anticipate that our data will be the base for future research on obesity treatments and drugs in Saudi Arabia.
Study design
Our study was carried out using descriptive cross-sectional questionnaire study. The questionnaire have constructed after reviewing the literature. After questionnaire validation, we did the pilot study and made minor modifications according to the participants responses.
Study setting/location
A convenience sampling method was adopted to distribute the surveys. We distributed paper surveys in multiple setting in different regions of Riyadh city (e.g. Almaarefa colleges, Prince Sultan University, hospitals, diet centers, gyms), whereas electronic surveys was spread using social media applications.The study conducted during March-May 2018-19.
Study population
Female Saudi nationality total responses were 1208.
Ethical consideration
After approval of the institutional ethical review committee; an informed verbal consent of study subjects was obtained with assurance of confidentiality and anonymity of the data.
Data collection
A structured questionnaire was used to collect the following data: Firstly, sociodemographic characteristics, for example, age group, gender, nationality, marital status, profession, educational level, income. Secondly, it included health-related questions such as height, current weight, and current health status. In addition to weight lowering practices questions, for example, methods used to lose weight, reasons to reduce weight. In addition, weight lowering medications associated questions including taking drugs with diet or exercise, type of medication, period of using medication, estimate of weight change, side effects suffered from medication. Lastly, questions on the knowledge about weight lowering drugs such as knowing the advantages and disadvantages from using weight lowering medication, other indications for these drugs, general drug interaction with food or other drugs.
Data cleaning and analysis
Data were analyzed using SPSS (IBM Corp. Released 2011). Univariate descriptive statistics performed to summarize and present data. Categorical variables reported as count and percentage, whereas continuous variables reported as mean and standard deviation. We compared participants’ responses on using weight lowering medications with number of nominal and ordinal variables such as age group and marital status, in addition to continuous variables such as BMI. Cross tabulation and Chi-square tests were used to determine the association between categorical variables (nominal, ordinal) and categorical outcomes. Quantitative data were described as means after testing of normality by Kolmogorov- Smirnov test. BMI showed not follow normal distribution, so we used non-parametric Kruskal-Wallis which doesn’t require normality condition to compare means within groups. “P value ≤ 0.05” was considered to be statistically significant.
As illustrated in Figure 1, the total number of participants was 1208 (Electronic: 916, Paper: 292). After applying inclusion and exclusion criteria, we included 820 participants (electronic: 647, paper: 173). As seen in Table 1, the majority of participating females were in age group 19-25, followed by age group 26-35. The least age group reported was elderly more than 56 (Figure 2). 62.7% of females were single, while 28.4% were married (Figure 3). Furthermore, 53.6% were students, 19.1% were housewives. Most of the participants had bachelor's degree (72.2%) followed by high school 16.5%, diploma and higher education was in similar percentage 4.5% (Figure 4). According to monthly income, 30% of participants had 10000-20000 Saudi Riyal as family monthly income followed by 28.4% for 5000-10000 Saudi Riyal, the lowest percentage was for who had monthly income less than 5000 Saudi Riyal.
| Variables | Frequency | % |
|---|---|---|
| Age | ||
| Less than 18 | 55 | 6. 7 |
| 19-25 | 485 | 59. 1 |
| 26-35 | 176 | 21. 5 |
| 36-45 | 77 | 9. 4 |
| 46-55 | 22 | 2. 7 |
| More than 56 | 5 | 0. 6 |
| Marital status | ||
| Single | 514 | 62. 7 |
| Engaged | 49 | 6 |
| Married | 233 | 28. 4 |
| Divorced | 22 | 2. 7 |
| Widowed | 1 | 0. 1 |
| Profession | ||
| Housewife | 157 | 19. 1 |
| In the medical field | 75 | 9. 2 |
| In the educational field | 88 | 10. 7 |
| Field job | 9 | 1. 1 |
| Office job | 58 | 7. 1 |
| student | 439 | 53. 6 |
| Others | 32 | 3. 9 |
| Educational level | ||
| Illiterate | 1 | 0. 1 |
| Primary school | 3 | 0. 4 |
| Intermediate school | 14 | 1. 7 |
| High school | 135 | 16. 5 |
| Diploma | 37 | 4. 5 |
| Bachelor’s degree | 592 | 72. 2 |
| Higher education | 36 | 4. 4 |
| Income | ||
| Less than 5000 SR | 154 | 18. 8 |
| 5000-10000 SR | 231 | 28. 4 |
| 10000-20000 SR | 244 | 30 |
| More than 20000 SR | 185 | 22. 7 |
Table 1: Demographic characteristics.
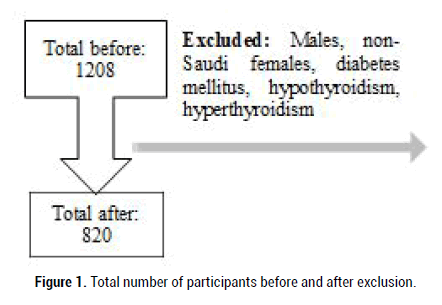
Figure 1: Total number of participants before and after exclusion.
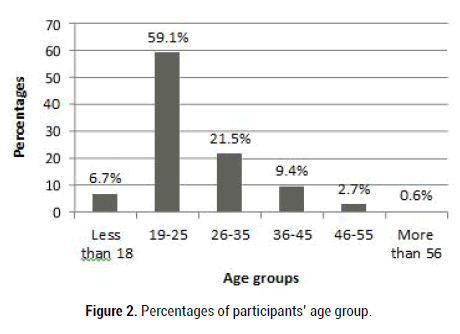
Figure 2: Percentages of participants’ age group.
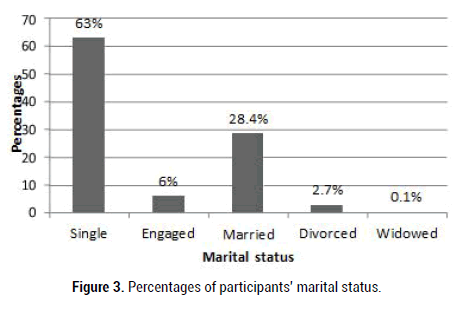
Figure 3: Percentages of participants’ marital status.
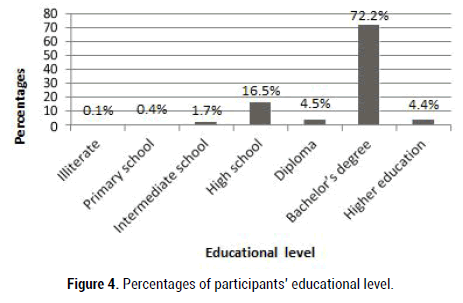
Figure 4: Percentages of participants’ educational level.
In general, Body Mass Index (BMI) of participants followed a skewed normal distribution; where the highest percentage (40.8%) was for normal BMI (18.6-24.9) then began to decrease as BMI increased as it showed in Figure 5. There were numbers of factors that may have association with BMI such as age, marital status, educational level, and income. Table 2 demonstrated the p-value for age group and marital status to be equal to 0.000. Moreover, the p-value for monthly income was equal to 0.045. On the other hand, educational level had no significant p-value with BMI in our study.
| Variables | BMI | p value | ||||
|---|---|---|---|---|---|---|
| 18. 5–24. 9 | 25. 0–29. 9 | 30. 0–34. 9 | 35. 0–39. 9 | Above 40 | ||
| Age | 0 | |||||
| Less than 18 | 35 | 11 | 3 | 1 | 0 | |
| 19-25 | 228 | 122 | 49 | 18 | 13 | |
| 26-35 | 52 | 64 | 31 | 14 | 5 | |
| 36-45 | 10 | 28 | 19 | 14 | 5 | |
| 46-55 | 2 | 7 | 9 | 1 | 3 | |
| More than 56 | 2 | 1 | 0 | 1 | 1 | |
| Marital status | 0 | |||||
| Single | 252 | 125 | 52 | 20 | 11 | |
| Engaged | 17 | 12 | 11 | 0 | 1 | |
| Married | 59 | 85 | 40 | 27 | 14 | |
| Divorced | 1 | 11 | 8 | 1 | 1 | |
| Widowed | 0 | 0 | 0 | 1 | 0 | |
| Educational level | 0. 052 | |||||
| Illiterate | 0 | 0 | 1 | 0 | 0 | |
| Primary school | 2 | 0 | 1 | 0 | 0 | |
| Intermediate school | 8 | 0 | 2 | 2 | 1 | |
| High school | 55 | 40 | 18 | 7 | 2 | |
| Diploma | 4 | 14 | 7 | 5 | 3 | |
| Bachelor’s degree | 245 | 162 | 79 | 33 | 21 | |
| Higher education | 14 | 17 | 3 | 2 | 0 | |
| Income | 0. 045 | |||||
| Less than 5000 SR | 51 | 46 | 26 | 14 | 6 | |
| 5000-10000 SR | 85 | 65 | 33 | 16 | 14 | |
| 10000-20000 SR | 104 | 69 | 35 | 10 | 6 | |
| More than 20000 SR | 86 | 52 | 17 | 9 | 1 | |
Table 2: Cross tabulation showing frequency and relationship between BMI with demographic characteristics (age, marital status, educational level, income).
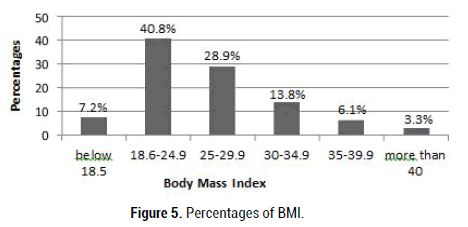
Figure 5: Percentages of BMI.
Notably, 22.4% of participants didn’t want to lose weight. As illustrated in Table 3, diet and exercise were the main methods used by participants to lose weight (64.1%, 61.5% respectively). In addition, the most common reasons to lose weight as reported by participants were to enhance appearance (70.3%), to improve physical fitness (46.5%), and for health reasons (27.8%); given that all percentages in Table 3 were from the total number of participants.
| Questions | Frequency | % |
|---|---|---|
| Try to lose weight | ||
| Yes | 635 | 77. 6 |
| No | 183 | 22. 4 |
| Methods to lose weight | ||
| Diet | 524 | 64. 1 |
| Exercise | 503 | 61. 5 |
| Surgery | 28 | 3. 4 |
| Medication | 124 | 15. 2 |
| Herbal products | 106 | 13. 0 |
| Nothing | 169 | 20. 7 |
| Reasons to lose weight | ||
| For health reasons | 228 | 27. 8 |
| To improve my appearance | 576 | 70. 3 |
| To improve my physical fitness | 381 | 46. 5 |
| To follow my doctor's advice | 47 | 5. 7 |
| Recommended by family or friends | 8 | 1. 0 |
| To be a better role model | 59 | 7. 2 |
| For my family's sake | 32 | 3. 9 |
| Other | 4 | . 5 |
| I don’t want to lose weight | 31 | 3. 8 |
Table 3: Frequency Table of questions about try, methods and reasons for weight loss.
Furthermore, the prevalence of using weight lowering medication among Saudi females was 21.3% (Figure 6). The number of respondents who used drugs to lose weight along with diet reached 111 people, 86 of them with exercise and 75 with both diet and exercise. Table 4 showed that there is no relationship between weight change and taking drugs with diet (p-value 0.168), also with exercise (p-value 0.203), although people who used drugs with either diet, or exercise or both had 73.6% probability to lose weight. Further, the p-value for periods of using drugs with weight change was equal to 0.000.
| Questions | Weight Change | Total | p value | |||||
|---|---|---|---|---|---|---|---|---|
| I gained weight |
I did not changed |
I lost less than 3 kg |
I lost 4-6 Kg | I lost 7-9 Kg | I lost more than 10 kg |
|||
| Drug with diet | 0. 168 | |||||||
| Yes | 2 | 25 | 26 | 35 | 9 | 13 | 110 | |
| No | 5 | 18 | 17 | 13 | 7 | 4 | 64 | |
| Total | 7 | 43 | 43 | 48 | 16 | 17 | 174 | |
| Drug with exercise | 0. 203 | |||||||
| Yes | 3 | 18 | 20 | 25 | 6 | 13 | 85 | |
| No | 4 | 25 | 23 | 23 | 10 | 4 | 89 | |
| Total | 7 | 43 | 43 | 48 | 16 | 17 | 174 | |
| Period of drug use | 0. 00 | |||||||
| Irregularly | 1 | 7 | 4 | 6 | 1 | 3 | 22 | |
| Less than 1 month | 3 | 19 | 8 | 5 | 2 | 3 | 40 | |
| 1–2 months | 0 | 12 | 18 | 9 | 7 | 6 | 52 | |
| 3–4 months | 1 | 1 | 11 | 16 | 5 | 0 | 34 | |
| 5–6 months | 0 | 2 | 1 | 8 | 0 | 1 | 12 | |
| 7–12 months | 1 | 2 | 0 | 3 | 0 | 3 | 9 | |
| More than 1 year | 1 | 0 | 1 | 1 | 1 | 1 | 5 | |
| Total | 7 | 43 | 43 | 48 | 16 | 17 | 174 | |
Table 4: Cross tabulation showing frequency and relationship between patterns of using drugs for weight loss with weight change.
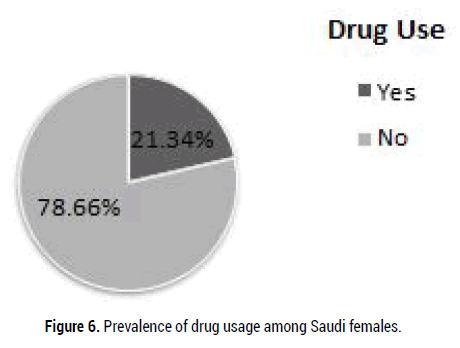
Figure 6: Prevalence of drug usage among Saudi females.
Lowering weight using medications was found to be significantly associated with age and marital status (p-value .000); however, there was no significant p-value between educational level and income with using drugs to lose weight. Table 5 and Figure 7 illustrated that highest number of drug users were among age group 19-25, followed by 26-35. On the other hand, married females consumed more anti-obesity drugs than others. In addition to that participants with monthly income around 5000- 10000 Saudi Riyal were using drugs more than other groups.
| Questions | Drug use | p value | |
|---|---|---|---|
| Yes | No | ||
| Age | 0. 00 | ||
| Less than 18 | 3 | 52 | |
| 19-25 | 66 | 419 | |
| 26-35 | 57 | 119 | |
| 36-45 | 40 | 37 | |
| 46-55 | 6 | 16 | |
| More than 56 | 3 | 2 | |
| Marital status | 0. 00 | ||
| Single | 67 | 447 | |
| Engaged | 18 | 31 | |
| Married | 76 | 157 | |
| Divorced | 13 | 9 | |
| Widowed | 1 | 0 | |
| Educational level | 0. 711 | ||
| Illiterate | 0 | 1 | |
| Primary school | 1 | 2 | |
| Intermediate school | 2 | 12 | |
| High school | 28 | 107 | |
| Diploma | 12 | 25 | |
| Bachelor’s degree | 124 | 468 | |
| Higher education | 8 | 28 | |
| Income | 0. 097 | ||
| Less than 5000 SR | 41 | 113 | |
| 5000-10000 SR | 56 | 175 | |
| 10000-20000 SR | 43 | 201 | |
| More than 20000 SR | 35 | 150 | |
Table 5: Cross tabulation showing frequency and relationship between using weight lowering drugs and age, marital status, educational level, income.
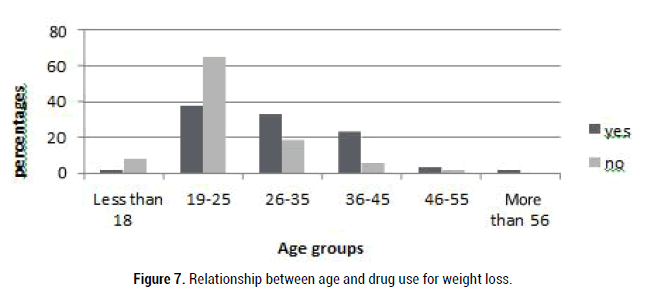
Figure 7: Relationship between age and drug use for weight loss.
Further, there was a statistically significant difference in BMI between the different drug usage p=0.000. From Figure 8 we deduced that the probability of using drugs increased when BMI increased. In addition, the average BMI for drug users was 30.29, whereas the average for non-drug users was 24.68.
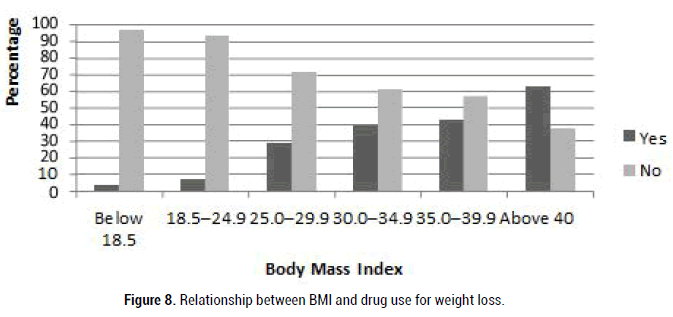
Figure 8: Relationship between BMI and drug use for weight loss.
Table 6 and Figure 9 showed the most common drugs used for weight loss to be Orlistat 46(26.4%), Metformin 36(20.7%), and Fibers PGX 13(7.5%). 17.8% of participants reported using other drugs such as Sibutramine, dietary supplements, and natural products. Furthermore, 25.9% of the participants who were consuming weight lowering medication did not know the type of medication they were using; given that all percentages for drugs used were calculated out of the total number of participants.
| Questions | Frequency | % |
|---|---|---|
| Drug | ||
| Orlistat (Xenical) | 46 | 26. 4 |
| Liraglutide(Victoza, Saxenda) | 1 | 0. 6 |
| Lorcaserin (Belviq) | 1 | 0. 6 |
| Naltrexone-bupropion (Contrave) | 2 | 1. 1 |
| Phentermine-topiramate (Qsymia) | 3 | 1. 7 |
| Metformin (Glucophage) | 36 | 20. 7 |
| Fibers (PGX) | 13 | 7. 5 |
| Unknown | 45 | 25. 9 |
| Others | 31 | 17. 8 |
| Period for drug use | ||
| Irregularly | 22 | 12. 6 |
| Less than 1 month | 40 | 23 |
| 1–2 months | 52 | 29. 9 |
| 3–4 months | 34 | 19. 5 |
| 5–6 months | 12 | 6. 9 |
| 7–12 months | 9 | 5. 2 |
| More than 1 year | 5 | 2. 9 |
| Weight change | ||
| I gained weight | 7 | 4 |
| I did not changed | 43 | 24. 7 |
| I lost less than 3 kg | 43 | 24. 7 |
| I lost 4-6 | 48 | 27. 6 |
| I lost 7-9 | 16 | 9. 2 |
| I lost more than 10 kg | 17 | 9. 8 |
Table 6: Most common used drugs, periods for drug use, weight change.
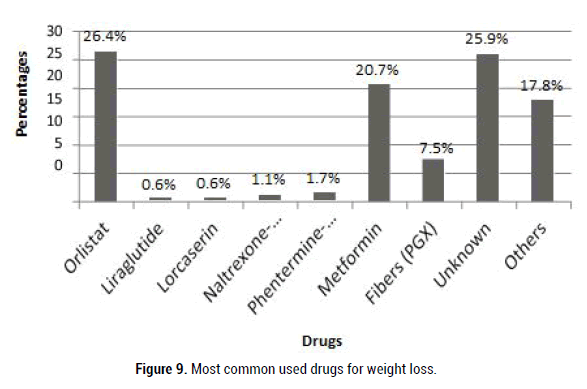
Figure 9: Most common used drugs for weight loss.
Additionally, Table 6 showed the longest period for using drugs for weight loss was from 1 to 2 months, followed by taking drugs for less than 1 month (23%) and for 3 to 4 months (19.5%), respectively. Likewise, 27.6% of females who took medications lose 4 to 6 kilograms. Notably, there was 4% who gained weight from using weight lowering medications.
As illustrated in Figure 9, the most-frequently self-reported side effects from weight lowering medications were oily spotting (25.9%), headache (19.5%), diarrhea (17.2%), nausea (16.7%) and insomnia (16.1%). 28.7% of participants reported no side effects while they took the medications; where the percentages were calculated out of the total number of respondents. Table 7 showed drugs and their most-frequently reported side effects. Orlistat had oily spotting as most stated side effect, while metformin had nausea then oily spotting and diarrhea.
| Questions | Drugs | |||||||||
|---|---|---|---|---|---|---|---|---|---|---|
| Side Effects | Orlistat | Liraglutide | lorcaserin | Contrave | Qsymia | Metformin | PGX | Don't know | Other drug | Total |
| Constipation | 4 | 0 | 0 | 0 | 1 | 3 | 4 | 9 | 3 | 23 |
| Headache | 8 | 0 | 1 | 1 | 1 | 6 | 3 | 10 | 5 | 34 |
| Dry mouth | 7 | 0 | 1 | 0 | 0 | 2 | 0 | 5 | 8 | 23 |
| Insomnia | 5 | 0 | 0 | 0 | 1 | 5 | 1 | 11 | 8 | 28 |
| Diarrhea | 8 | 0 | 1 | 1 | 0 | 9 | 1 | 8 | 2 | 30 |
| Fecal incontinence | 1 | 0 | 0 | 0 | 0 | 2 | 0 | 2 | 1 | 6 |
| Oily spotting | 24 | 0 | 0 | 0 | 0 | 9 | 0 | 8 | 6 | 45 |
| Flatulence | 4 | 0 | 0 | 0 | 0 | 4 | 1 | 2 | 1 | 12 |
| Bloating | 2 | 0 | 0 | 0 | 0 | 5 | 0 | 1 | 2 | 10 |
| Dyspepsia | 4 | 0 | 0 | 0 | 0 | 5 | 0 | 1 | 0 | 10 |
| Fatigue | 6 | 1 | 0 | 0 | 1 | 5 | 0 | 3 | 3 | 17 |
| Dizziness | 2 | 0 | 0 | 1 | 0 | 7 | 2 | 8 | 8 | 25 |
| Nausea | 3 | 0 | 0 | 0 | 0 | 10 | 2 | 10 | 6 | 29 |
| No side effect | 5 | 0 | 0 | 0 | 1 | 8 | 7 | 17 | 12 | 50 |
| Other side effect | 1 | 0 | 0 | 0 | 0 | 0 | 0 | 3 | 1 | 5 |
Table 7: Frequency of self-reported side effects of weight lowering medications.
Lastly, we found that 68.3% of total respondents knew the advantages and disadvantages of using weight lowering drugs, 25.4% knew that there are other indications for these drugs, 37.1% knew general interactions for weight lowering drugs, as provided in Table 8. However, there was no strong statically association between having knowledge about weight lowering medication drug use. In Table 9, those who have more knowledge about drugs were less-likely to consume them. Participants who took medications were 29% likely to not know the advantages and disadvantages for these medications.
| Questions | Frequency | % |
|---|---|---|
| Advantage and disadvantage | ||
| Yes | 560 | 68. 6 |
| No | 256 | 31. 4 |
| Main indication | ||
| Yes | 208 | 25. 5 |
| No | 607 | 74. 5 |
| General drug interactions | ||
| Yes | 304 | 37. 2 |
| No | 513 | 62. 8 |
Table 8: Questions about weight lowering medications knowledge.
| Questions | Advantage and disadvantage |
Main indication |
General drug interactions | ||||
|---|---|---|---|---|---|---|---|
| Yes | No | Yes | No | Yes | No | ||
| Drug use | |||||||
| Yes | 122 | 52 | 59 | 115 | 73 | 102 | |
| No | 438 | 204 | 149 | 492 | 231 | 411 | |
| p value | 0. 634 | 0. 004 | 0. 164 | ||||
Table 9: Cross tabulation showing frequency and relationship between knowledge about weight lowering drugs and drug use.
Obesity is considered one of the major diseases of this era mainly due to its association with a higher risk of death and many metabolic disorders such as hypertension, diabetes mellitus, and dyslipidemia [5-7]. According to the World Health Organization (WHO), in 2014, it was estimated that 1.9 billion individuals aged older than 18 years were overweight (i.e. BMI greater than or equal to 25). Additionally, 600 million of those were clinically obese (i.e. BMI greater than or equal to 30) which is 13% of the total adults population around the world. Data showed that the percentages of overweight and obese were higher in women [8]. On a global level, many countries approximately spend 3% of their health expenses on the management of obesity comorbidities [9].
There are several common approaches in order to lose weight that fall into two categories. On one hand, non-pharmacological options include exercise and higher physical activity, a healthy diet with low calories and, lastly, bariatric surgery as a final solution. On the other hand, pharmacological methods include the assist of drugs prescribed for weight loss [10]. However, it is not advised to incorporate such drugs until the other options are showing insufficiency, and for some cases in individuals with BMI equal or above 27 that have additional risk factors such as hypertension, type 2 diabetes mellitus, or dyslipidemia [11].
There are a number of drugs approved by FDA for weight loss with different mechanism of action. For instance, Orlistat acts by inhibiting absorption of dietary fat through inhibiting gastrointestinal lipases, while Lorcaserin promotes satiety by activating Serotonin receptors. [12,13] Moreover, Liraglutide is an antidiabetic drug that is certified for weight loss with strength of 3 mg. [14] Additionally, Naltrexone-Bupropion combination acts centrally to regulate food intake, while Phentermine with Topiramate act centrally through Catecholamine receptors resulting in reduced appetite and lesser food consumption [15,16]. It has been recommended to take these medications along with low-calorie diet and exercise [17].
According to one study conducted in the United States, the prevalence of using weight lowering medication in 2008 was 2.35 million and increased to 2.74 million in 2011, and 62% were in between the age of 17 to 44 years and 85% of the aggregated users were female [11].
In year 2016, a systematic review and meta-analysis were conducted to compare the effectiveness and adverse effects in weight loss medications approved by FDA [18]. They included 28 randomized clinical trials conducted on overweight and obese patients who received one of the following drugs: Orlistat, Lorcaserin, Naltrexone-Bupropion, Phentermine- Topiramate, or Liraglutide. Among the 29018 participants, all FDA approved drugs were associated with significant weight loss at a minimum of 5% in one year compared to placebo trials. Liraglutide and Naltrexone-Bupropion had the highest treatment discontinuation rate due to adverse events.
First of all, our study appears to be the only one in the literature to provide data on the prevalence of using weight lowering medications and their side effects among Saudi females. In our study sample, it has shown that 21.3% of Saudi females had used weight lowering medications. Similar results have been found in Liou et al. study which showed 27.2% of females in Taiwan used anti-obesity drugs [19]. Our finding seems justifiable since it is in good correlation with the prevalence of obesity among the participants (23.1%).
Secondly, people who used drugs in addition to diet and/or exercise were more-likely to lose weight. Moreover, there appears a good association between the period of drug usage and weight reduction; the longer a certain drug is used, the more weight is loss. Consuming those medications regularly for longer periods will certainly help to achieve the goal of losing excess weight. However, it is important to mention that currently there is no evidence on the long- term safety of these drugs. Therefore, it is highly-advised to only take such drugs under medical supervision.
Furthermore, our analysis showed a strong association between age of the participants and consumption of weight loss drugs (p-value 0.000). This result is in agreement with Liou et al. study that indicated people within the age group of 19-25 were the most frequent users [19]. This is certainly reasonable since younger adults are more self-conscious regarding their appearance than older adults. This supposition is sensible since 80% young adults indicated in the survey that they used drugs mainly as a mean to improve appearance. Similarly, that same goal appeared to be the number one driving reason to lose weight throughout the BMI spectrum. Among our obese participants (BMI 30-35), the second leading motivation for them to lose extra weight was health concerns.
Moreover, married females were more susceptible to use the help of drugs in comparison to single counterparts. The results showed that BMI was significantly associated with marital status, i.e. rate of weight gains increased in married women. Supposedly, this could be explained by wives propensity to lose weight for the pleasure and approval of their partners.
In this study, we examined the relationship between BMI and drug usage and found it to be significant. Also, means of BMI values for those who used weight lowering medications is higher than those who didn’t use any. Plausibly, increased BMI means increased in fat composition therefore more people tend to use drugs together with other methods to reduce weight. Thus, we can deduce that there is a positive relationship between BMI and drug use. This result is in agreement with Liou's finding; when BMI increases, probability of using drugs rises as well [19].
Additionally, our study showed that there is no apparent relationship between using drugs for weight loss and education level. On the contrary, one study reported that low levels of education had a positive correlation with low levels of using weight lowering medications [20]. Orlistat and Metformin were used more frequently in Saudi Arabia among females due to the fact that Orlistat is the only approved drug for such purpose. In a similar study in Taiwan, Liou's et al. Sibutramine and Orlistat were found to be the most widely-used prescription drugs for weight-loss [19]. Notably, 17.8% of our respondents stated using products that have not been adequately studied for effectiveness or safety, such as dietary supplements and other marketed natural products for weight loss. This could be precipitated by lack of awareness among Saudi population; as many believe these products have no side effects since they are all natural. Also the influence of advertisements of these products may strongly affect people’s decisions.
This study had much strength like the surveys were distributed in multiple settings and locations such as universities, hospitals, gyms, and on social media to ensure that we covered all layers and classes of the society. There is a gap in studying the prevalence of use of weight lowering medications on Saudi women, so we filled this gap. Our study did not only cover approved drugs, but also the unapproved ones in addition to drugs that are sold on the internet and it identified the associated side effects and the relationship between using these drugs and many other factors. Some Limitations of the present study were as follows: Self-administered questionnaires may lead to misunderstanding of some questions by the participants. Underreporting of some drugs may be caused by recall bias, because some participants do not know the name of the drugs that they used. We did not ask when the participants use weight lowering drugs. However, we asked about the periods of taking them. We recommend future researchers to include males in the study and compare it with the results of females study.
We found that Saudi females were using weight lowering medications and it was related to several factors such as the BMI and the ages of participants. However, dieting and exercising were still the main methods used by the participants to lose weight. Although the US FDA has approved number of weight loss drugs, Orlistat is the only drug registered in Saudi Arabia for weight loss. There are limited studies about weight lowering medication usage among Saudi population and their perception about these medications. Therefore, a study should be conducted to fill the gap and serves as a base for future researches.
For data collection; AsmaAman, Dalia Alrass, RawanAldhrgham, ArwaGamal, Sara Almarjan, Health science students, Al MaarefaCollege, Riyadh, KSA.
Citation: Tabinda Hasan and Kavitha Ganesh. Weight Lowering Medications to Alter Morphological Indices: A Cross-Sectional Study among Saudi Females. J Biol Today's World, 2020, 9(8), 001-008.
Received: 05-Jul-2020 Published: 27-Jul-2020, DOI: 10.35248/2322-3308.20.9.008
Copyright: 2020 Hasan T, et al. This is an open-access article distributed under the terms of the Creative Commons Attribution License, which permits unrestricted use, distribution, and reproduction in any medium, provided the original author and source are credited.