Research Article - (2018) Volume 4, Issue 1
Background: Hypertension like many chronic conditions require long term care, posing financial burden to the patients and their households. Even in countries with universal healthcare coverage, patients including those with chronic conditions can still incur substantial and increasing amounts of out-of-pocket expenditure (OOPE).However, the OOPE burden of hypertension has not been studied in the Ethiopian context.
General objective: The objective of the study was to assess out of pocket expenditures among hypertensive patients and their households who visit public hospitals in Addis Ababa, Ethiopia, 2016.
Methods: An institution based cross sectional study was conducted on 422 participants in public hospitals that provide care for hypertension in Addis Ababa city from September 01, 2016 to September 20, 2016. Structured questionnaires were used to collect the data. Then the data was entered and analyzed using the statistical package for social scientists version 20 (SPSS-20) and analyses were performed for household out of pocket expenditure that considered estimated direct and indirect out of pocket expenditure and household expenditure by using descriptive statistics.
Results: The study covered 422 hypertensive patients and revealed that the total out pocket expenditure was estimated at median 5279.50 (mean 7194.00) birr/month, household expenditure (households food and non-food expenditure) was significant which estimated at median 5148.50 (mean 5003.29) birr/month. The direct cost of hypertensive patient was estimated at median 283 (mean 290.74) birr/month.
Conclusion and recommendation: The average OOPE of hypertension to patients and their households were very high when compared with the mean monthly household income. Therefore further research ought to be done including economic consequence, catastrophic Health expenditure, impoverishments, coping mechanism and social resources of hypertension on patients and their households. Health Policymakers and health managers should prioritize the resources need for the hypertension prevention and control activities.
Keywords: Out of pocket health expenditure; Hypertension; Household
Chronic conditions are by definition long-term and patients with such conditions often require continuing care. Responding to the care demands of people with chronic conditions is a challenge in most countries in the world. Health services may impose a regressive cost burden on households. Even in countries with universal healthcare coverage, patients including those with chronic conditions can still incur substantial and increasing amounts of out-of-pocket expenditure (OOPE) [1].
Hypertension, otherwise known as high blood pressure, is a leading cause of cardiovascular disease (CVD) worldwide. The proportion of the global burden of disease attributable to hypertension has significantly increased from about 4.5 percent (nearly 1 billion adults) in 2000, to 7 percent in 2010. This makes hypertension the single most important cause of morbidity and mortality globally and highlights the urgent need of action to address the problem [2].
Hypertension, the most common cardiovascular disorder affecting approximately one billion people globally, remains the leading single contributor to global burden of disease and mortality accounting for approximately 9.4 million deaths annually. In 2000, there were an estimated 972 million people with hypertension, 65% of whom lived in the developing world, with the number predicted to grow to 1.5 billion by 2025. The effects of hypertension if not controlled are devastating and may include stroke, myocardial infarction, cardiac failure and renal failure among others [3].
Hypertension is a chronic condition in which the blood pressure in arteries or veins is abnormally high and defined as a systolic blood pressure equal to or above 140 mm Hg and/or diastolic blood pressure equal to or above 90 mm Hg. Non-communicable diseases (NCDs) are the major cause of death in the world, accounting for more than 36 million (63%) of the 57 million deaths that happened in 2008. Almost half, (48%) of NCD deaths are due to cardiovascular diseases (CVD). Hypertension is one of the main modifiable risk factors for CVD [4]. While it is clear that the burden of non-communicable diseases is growing and is already a major problem even in the poorest countries, the questions of whether people have access to the services they need to prevent or control these diseases and the extent to which they suffer financial catastrophe or impoverishment in obtaining the services they need is less well [5].Therefore the purpose of this study is to address this gap by assessing the extent of out of pocket expenditures among hypertensive patients and their households who visit public hospitals in Addis Ababa, Ethiopia, 2016.
Problem statement
The burden from non-communicable diseases is growing globally. At the same time, there is an increased focus on ensuring that people are protected against financial risks due to accessing care. The World Health Repot of 2010, entitled “Health Systems Financing, the Path to Universal Coverage” showed that over a billion people are unable to use the health services they need, while a 100 million people are pushed into poverty and 150 million people face financial hardship because they have to pay directly from their out of pocket for the health services they use at the point of delivery [6].
Study in low and middle income countries showed that health shocks, whether an event of death or disease, can cause significant adverse economic outcomes for households in low and middle income countries (LMICs). Poor health among members can increase the risk of a household becoming destitute if there is significant out of pocket (OOP) healthcare expenditures incurred to obtain healthcare. Even if OOP treatment costs are avoided by not seeking care, the household to which a sick individual belongs may still forgo earnings if work days are lost by the sick individual or his informal caregivers. From a policy standpoint, any adverse economic outcomes of health shocks of households hinder progress on national development goals such as poverty reduction and economic growth. Excessive reliance on OOP health spending may also ration scarce healthcare services away from the less well-off to those who can afford to pay, enhancing inequalities in access to care [7].
Rationale of the study
Therefore the purpose of this study was to address the aforementioned gap by comparing out of pocket expenditures among hypertensive patients and their households and thereby, to allow health policymakers and health managers, in prioritization of scarce health resources based on evidence. In addition, context specific studies are more desirable than depending on studies conducted elsewhere even within the same country as local circumstances can lead to significant difference in risk factors and health care costs.
The 2010 WHO Global Status review on non-communicable diseases (NCDs) showed that they are now the most important cause of mortality worldwide. Indeed, more than 36 million people died from NCDs in 2008, mainly cardiovascular diseases (48%), cancers (21%), chronic respiratory diseases (12%) and diabetes (3%). Nearly 80% of these deaths occurred in low- and middle income countries (LMICs), where, on average, they now exceed communicable diseases as the major cause of disease burden [8].
Globally an estimated 1.3 billion people do not have access to effective and affordable health care and of those who have access about 170 million are forced to spend more than 40 percent of their household income on medical treatment [9]. Financial barriers are a key limitation to accessing health services in LMICs where out-of-pocket (OOP) payments finance a significant proportion of health expenditure [10]. In 33 mostly low-income countries, direct OOP payments represented more than 50% of total health expenditures in 2007. There is high probability of many households in LMICs being pushed into poverty when faced with substantial medical expenses, particularly when this is combined with a loss of income due to ill health [11].
Health-related expenditures impoverish an estimated 100 million people in low and middle income countries (LMICs) each year. An estimated 50 million more suffer from catastrophic health expenditures, defined as expenditures of 10% or more of income Catastrophic health expenditure (CHE) occurs when out-of-pocket (OOP) payments for health services consume such a large portion of a household’s available income and the household may be pushed into poverty as a result. In situations where health financing mechanisms that protect households against the financial risks associated with ill health are unavailable or deficient, even modest healthcare bills could lead to CHE. In addition to financial shock from medical expenses for treatment, households are often faced with income loss if affected members are working adults. The possibility that CHE leads households into impoverishment thus raises equity concerns [12].
There is no single accepted definition of catastrophic Health expenditure. Some researcher defines CHE as out of pocket healthcare payments (OOP) that comprise ≥ 10% of total household expenditures [13]. Still other researchers describe CHE as out-of pocket healthcare payments that comprise ≥ 40% of nonfood household expenditures [14]. By deducting food expenses, the latter indicator can partly avoid measurement deviation that poor households which cannot afford to meet catastrophic payments are ignored [15].
Ill health can have a significant economic impact on a household. Such an impact can trigger a spiral of asset depletion, indebtedness and reductions of essential consumption. Health services may impose a regressive cost burden on households, especially in developing countries. The economic burden has two effects; first, the immediate loss of income due to absence from work; and second, large out of pocket expenses to cover the necessary medical care. Costly health care also deters people from using health services thereby generating prolonged or worsened health problems .In addition, illness often place large intangible costs on households in terms of quality of life, discomfort and pain [16].
Out-of-pocket payment for medical services is very high in most developing countries and the household’s catastrophic medical expenses are being used as one of the indicators measuring whether out-ofpocket payment disrupts material living standards of individuals and household’s. Reducing incidence of household catastrophic medical expenses is one of the objectives of health policy. Understanding the incidence of catastrophic medical expenses and its determinants is the basis for developing effective health policies to address this problem [17].
Protecting households from catastrophic health care costs is a desirable objective of health systems worldwide. The World Health Organization (WHO) call for universal health coverage emphasized the need to protect households from catastrophic medical expenses and impoverishment arising from seeking health care. The call also urged health systems to ensure that health care costs do not prevent people from receiving needed health services. Globally it is estimated that 150 million people suffer financial catastrophe each year due to health care payments and about 100 million are pushed into poverty because of out-of-pocket (OOP) payments [18].
Bankruptcy and poverty following illness has been well documented among people who lack health care insurance in the United States, China, Korea and Russia. Many countries have established universal health insurance systems to deal with the financial burden of disease. For example, Thailand provides universal health insurance to successfully reduce catastrophic and impoverishing health expenditure [19].
As the incidence of non-communicable diseases (NCDs) rises, this is expected to increase, threatening gains in living standards over the past century [20]. Ethiopia’s fifth national health accounts 2010/2011 assessed spending on general health and revealed that, households manage 34 percent, all of their out-of-pocket health spending on general health. But the Economic burden of out of pocket expenditure of HPN was not specifically addressed under sub account.
A research suggests that households employ different strategies to cope with health shocks. In the short run, when medical bills exceed a household’s income, households may use savings, sell assets, borrow money from friends and family, or take out a loan using collateral. Families may also alter their labor allocation decisions; if a household head falls ill, family members previously not working may begin to do so to substitute for lost income and repay loans. Formal health insurance in developing countries is rare and many households also lack access to formal credit and savings arrangements [21].
The literature suggests that a wide range of household characteristics affect the probability of incurring catastrophic health expenditure. For example, availability of health insurance reduces the likelihood of occurrence of CHE [22]. On the contrary, households with hospitalized members, with elderly, or chronically ill members, households with co morbidity [17] and those who use in-patient service especially private hospitals are more likely to suffer from CHE [23]. Other factors that increase the likelihood of CHE are: age of head of household, children in the household, gender of the household head and level of education but not only limited to this. Moreover, results can be sensitive to methodology and definitions of key indicators such as the OOP expenditure [24].
Traditionally, economic burden of disease has been estimated in terms of direct costs, indirect costs and intangible costs [25]. Among the developing countries, financial hardship of health payments is reportedly higher in China and India, with households relying excessively on out of pocket health expenditure [26].
The overall objective of the study was to determine out of pocket expenditures among hypertensive patients and their households who visit hospitals in Addis Ababa, Ethiopia, 2016.
Study setting
Addis Ababa is the capital city of Ethiopia and located in the central part of the Oromiya. It is the largest as well as the dominant political, economic, cultural and historical city of the country established in 1887.The city is divided in to ten sub cities which are the second administrative units next to city administration. The sub cities are also divided in to Woredas, which are the smallest administrative unit in the city. There are 116 Woredas in the city administration. The population of Addis Ababa according to Central Statistics Authority (CSA) Urban Employment Unemployment survey study of 2012, there were a total of 3,061,404 populations in the town.
In Addis there are many health facilities providing HPN management services, six total government (public) hospitals four federal hospitals, 86 public/governmental health centers almost all health centers, private higher clinics and hospitals are providing the services.
For the purpose of this research the study was carried out in all Public Hospitals in Addis Ababa health Bureau (Tirunesh Beijing Hospital, Yekatit Hospital, Ras Desta Hospital, Zewditu memorial Hospital and Minilik Hospital).
Study design
The study was a cross sectional health facility based quantitative study conducted in Addis Ababa.
Study population
The source populations for this study were hypertensive patients in Addis Ababa. From these sources the study population was taken from five hospitals in Addis Ababa city administration Tirunesh Beijing hospital, Yekatit Hospital, Ras Desta Hospital, Zewditu Minilik Hospital and Zewditu memorial Hospital.
Inclusion criteria: Any randomly selected outpatient hypertensive clients who visit the hospitals at the time of data collection and who are willing to participate with written consent in the study was included.
Exclusion criteria: Pregnant women were excluded to avoid gestational hypertension whose effect may not last long and patients whose residential area was out of Addis Ababa to reduce inflation of the result. Since the objective of this study was to asses out of pocket expenditures among hypertensive patients and their households Who Visit Public hospitals in Addis Ababa. Inpatient hypertensive clients, insured hypertensive patients and beneficiary from fee waiver system were also excluded.
Sample size determination: The number of patient included in this study were determined by using the single population proportion formula, where the proportion and standard deviation of hypertension costs not available and lack of similar studies in this country, unknown population constant were used with the following assumptions: Expected proportion (p) of the study participants who had regular follow up and cost for their health assumed (50%), marginal error (d) 5% and confidence interval of 95%. A proportion of 50% will be preferred due to lack of similar studies. The formals were:
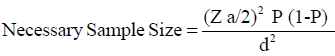
=((1.96)2 × 0.5(0.5))/(0.05)2
=(3.8416 × 0.25)/0.0025
=0.9604/0.0025=384.16
Non response rate=n*10%=384*10%=38.4 Total sample size=non response rate+n=38.4+384 ≈ 422
This yields a sample size of 384 respondents. Considering 10% non-response rate, the final sample size was determined to be 422.
Sampling procedure: Patient receiving Hypertension treatments in selected Public hospitals were selected by simple random sampling. The calculated sample size was divided per hospital proportional to their patient load using the formula of ni=n*Ni/N where Ni is required sample in each Hospitals’, n is total required sample in study, Ni assumed number of patients in each group. Representative samples for each health facility was 46, 22, 223, 28 and 103 from Tirunesh Beijing hospital, Yekatit Hospital, Ras Desta Hospital, Zewditu Minilik Hospital and Zewditu memorial Hospital respectively.
Data collection procedure
The data collection tools were developed based on the key study questions after reviewing relevant literature. Then, experts were reviewed it and provided feedback to fine tune the questionnaire. The data collection tool was prepared in English and translated to Amharic and then back to English to check its consistency. Data collectors used to facilitate the study had previous experience in similar field research. The data collectors were given one day training on the purpose, procedures and data collection tools. The study tools were pretested before the actual dates of data collection. The questionnaires were used for measuring household durable asset wealth status indicator, direct medical cost, indirect medical cost and factors affecting out of pocket expenditure. Facility exit interview were conducted. Face-toface interviews were conducted hypertensive patient who visits public hospitals. Trained data collectors carried out the interviews in specified time of data collection. Data completeness were checked each after data collection finished before to gratitude the study participant by data collector and then by supervisor.
Data quality management
To ensure the quality data before data collection training for data collectors was carried out for one day by the principal investigator on the objective, relevance of the study and confidentiality of information. The data collection procedure was pre tested in Zewditu Hospital on 5% of the sample size and necessary modifications were made to improve its clarity. Participants who were involved in the pretest were excluded from the main study itself by asking them whether they had participated in the pre-test and by confirming this with records or their Hypertension patient identity card and the list of individuals in the pre-test. Finally the data collection was carried out under the close supervision as close to data collection as possible by the principal investigator.
Variables
Dependent variable: Out of pocket expenditure among Hypertension patient and their households.
Independent variables: Socioeconomic and demographic variables such as, age, sex, marital status, occupation, monthly income, educational status, household’s size, distances of health facility.
Operational definition
• Direct costs are costs those associated with registration/ consultation, diagnostic work-up medications and transportation.
• Indirect costs are costs those associated with loss of working time of person who is ill and caregivers, loss of income of person who is ill and caregivers (due to absenteeism, missing business appointment, etc.).
• Household expenditure is defined as the sum of household food consumption expenditure and non-food consumption expenditures of the household.
• Catastrophic health expenditure, households whose financial contributions to the health care exceeded 40% of disposable income were considered as exposed to catastrophic healthcare expenditures.
• Disposable income is income after a tax that is available for your saving or spending.
• Out-of-pocket expenditure payments (OOP), payments made by a household for care and treatment of hypertension without compensations from a third party; example, included payments for doctor’s consultation fees, medication, laboratory tests and hospital bills and household expenditure.
Data analysis procedure
All data was entered Epi Info version 3.5.5 and analyzed using the statistical package for social scientists version 20 (SPSS- 20) statistical software and descriptive statistics were applied in analysis. Descriptive statistics in terms of frequency counts and percentages were used for discrete variables such as socioeconomic, demographic variables and direct and indirect treatment costs. Mean, median and standard deviations were calculated for all the continuous variables, certain socio-economic, demographic and various costs variables.
Information on household possessions (table, radio, television, bicycle etc) and food problems (had or never had food problems) was used to calculate a Household Wealth Index (HWI) based upon principal components analysis to characterize the wealth variance between households within the hypertensive household group. Households are grouped into three ‘wealth’ categories by first ordering all households in ascending order by value of household expenditure and then dividing them into three parts (poor, medium and rich). Calculation of the HWI was not adjusted for household size since the benefits of possessions would be available at the household level.
Ethical consideration
Ethical approval for the research was obtained from Addis Continental Institute of Public Health and Ethical clearance committee of Addis Ababa Administrative health Bureau. Official written letter by the Institute was given to all public hospitals in Addis Ababa. Therefore Permission was secured at all levels.
After Introduction of the data collector, participants were informed about the objectives and benefits of the research and its findings, before the data collection. They were also informed about the confidentiality of the information they give and written consent was obtained from each participants immediately. The participants were not required to write their names on the questionnaires.
The sex distribution of the study population showed that Out of total 422 samples individuals 67.1% male and the rest 32.9% were females. The age of individual included in this study ranges from 31 to 82 with mean age of 48. Relatively most of patients 291 (68.9%) were in age group of 45 to 64 and the 67 (15.8%) were between 15-44 years and the rest 64 (15.3%) were above 65 years (Table 1).
| S. No | Study area | Hypertensive subjects who visited health facility from Hamle 2007 to Miaza 2008 (Ni) | Sample size (Ni) |
|---|---|---|---|
| 1. | Tirunesh Beijing Hospital | 301 | 46 |
| 2. | Yekatit Hospital | 143 | 22 |
| 3. | Ras Desta Hospital | 1471 | 223 |
| 4. | Minilik Hospital | 185 | 28 |
| 5. | Zewditu Memorial Hospital | 682 | 103 |
| Total (N) | 2782 | 422 (n) | |
Table 1: Number of subjects/participants.
As it shown in Table 1, regarding the main employment status of the study population, in full time work, in part time work, currently seeking work, house wife, retired and merchants accounted for 78.9%, 1.7%, 3.6, 10.4%, 4% and 1.4 respectively. The study showed that the educational status of the study population, about 78% of the study participants have attended college or university education and 6.6% of the individuals attended (grades 9-12) (Table 2).
| Number | Percent | ||
|---|---|---|---|
| Sex | Male | 283 | 67.1 |
| Female | 139 | 32.9 | |
| Age | 15-44 Years | 67 | 15.8 |
| 45-64 Years | 291 | 68.9 | |
| >64 Years | 64 | 15.3 | |
| Marital status | Married | 366 | 86.7 |
| Living together | 23 | 5.5 | |
| Divorced | 19 | 4.5 | |
| Widowed | 14 | 3.3 | |
| Occupation | In full time work | 333 | 78.9 |
| In part time work | 7 | 1.7 | |
| Currently seeking work | 15 | 3.6 | |
| House wife | 44 | 10.4 | |
| Retired | 17 | 4 | |
| Merchant | 6 | 1.4 | |
| Educational status | Illiterate | 6 | 1.4 |
| Read and write | 20 | 4.7 | |
| Grade 1st-6th | 15 | 3.6 | |
| Grade 7th-8th | 24 | 5.7 | |
| Grade 9th-12th | 28 | 6.6 | |
| College/University | 329 | 78 | |
| Household size | 1-3 | 55 | 13 |
| 4-6 | 362 | 85.8 | |
| >6 | 5 | 5 | |
Table 2: The sex distribution of the study population, who had followed up in Public Hospital of Addis Ababa, September, 2016.
Family size of the study population showed of 422 study population (85.8%) had a family size of 4-6 persons per household. The rest 13 percent and 1.2 percent of the study population had a family size of 1-3 and >6 per household respectively (Table 3).
| Variables | N | Mean | Median | Std. deviation |
|---|---|---|---|---|
| Cost of registration | 422 | 5.00 | 5.00 | 0.00 |
| Cost of laboratory/Medical investigation | 422 | 24.11 | 20.00 | 18.46 |
| Cost of non-prescription medications | 422 | 67.95 | 70.00 | 12.36 |
| Cost of prescription medications | 422 | 119.94 | 100.00 | 41.19 |
| Cost of transportation | 422 | 5.79 | 4.00 | 4.75 |
Table 3: Direct costs of hypertensive patients, who had followed up in Public Hospital of Addis Ababa, September, 2016.
Direct cost includes cost registration, cost laboratory/Medical investigation and Costs of prescription medications, Costs of nonprescription medications and cost of transportation. Where a cost of registration was estimated with median 5 (with mean 5) birr/patient. On average cost of laboratory/Medical investigation was estimated at median 20 (mean 24.11) birr/patient. The study also showed that the cost of prescription medicine and non-prescription medicine was significant estimated at median 100.00 (with mean 119.94) birr/patient and at median 70.00 (mean 67.95 birr/patient. The cost of transportation was estimated at median 4.00 (5.79) birr/patient (Table 4).
| Variables | N | Mean | Median | Std. deviation |
|---|---|---|---|---|
| Direct out of pocket expenditure | 422 | 290.74 | 283.00 | 53.00 |
| Total out of pocket expenditure | 422 | 7194.00 | 5279.50 | 789.22 |
| Patient monthly income | 422 | 2817.65 | 2125.00 | 2310.33 |
| Households monthly income | 422 | 4615.67 | 3625.00 | 2628.94 |
Table 4: Patient and households monthly income and out of pocket expenditure of the study population, who had followed up in Public Hospital of Addis Ababa September, 2016.
The study showed that the total out pocket expenditure was at median 5279.50 (mean 7194.00) birr/month. On average the Patient monthly income and households monthly income was estimated at median 2125.00 (mean 2817.65 birr/month and median 3625.00 (at mean 4615.67 birr/month respectively. The direct cost of hypertensive patient was estimated at median 283 (mean 290.74) birr/month (Table 5).
| Variables | N | Mean | Median | Std. deviation |
|---|---|---|---|---|
| House hold food expenditure | 422 | 643.15 | 600.00 | 148.62 |
| House hold non-food expenditure | 422 | 4360.14 | 4456.00 | 819.62 |
| Total households expenditure | 422 | 5003.29 | 5148.50 | 4017 |
Table 5: Hypertensive patients and their household’s expenditure that followed up in Public Hospital of Addis Ababa, September, 2016.
The study revealed that the cost House hold food Expenditure, House hold nonfood Expenditure and total households expenditure was estimated at median 600.00 (Mean 643.15) birr/month, of median 4456.00 (mean of 4360.14) birr/month and median 5148.50 (mean of 5003.29) birr/month respectively (Table 6) (Figure 1).
| Variables | N | Mean | Median | Std. deviation |
|---|---|---|---|---|
| Patient time spent in days/month | 422 | 2.00 | 2.00 | 0.00 |
| Caretaker time spent in days/month | 422 | 1.00 | 1.00 | 0.69 |
Table 6: Loss of days by hypertensive patients and their care givers in who had followed up in Public Hospital of Addis Ababa, September, 2016.

Figure 1: Conceptual framework.
Indirect cost was a time devoted by hypertensive patients and their caregiver in seeking treatment during in one month’s recall period. It includes detail of time spent by patients and their caregiver having house hold rest, in seeking treatment. It was expressed by loss of days; directly by patients during follow up visits, 844 days with median of 2 days were used. In directly 418 days by caregivers with median of 1 day were used. Total days used by patients and their caregiver were 1262 days.
Among the study population the wealth index category showed that 12.3%, 72.3% and 15.4% for poor, medium and rich respectively (Table 7).
| Wealth index category | |||||
|---|---|---|---|---|---|
| Frequency | Percent | Valid percent | Cumulative percent | ||
| Valid | poor | 52 | 12.3 | 12.3 | 12.3 |
| medium | 305 | 72.3 | 72.3 | 84.6 | |
| rich | 65 | 15.4 | 15.4 | 100.0 | |
| Total | 422 | 100.0 | 100.0 | ||
Table 7: Wealth index category of the study population, who had followed up in Public Hospital of Addis Ababa September, 2016.
The household expenditure categories are used to disaggregate households by total household expenditure levels. The categories are calculated by first ordering all households in ascending order by value of household expenditure and then dividing them into three parts such that the first group includes the 12.3% of households with the lowest annual expenditure and the last group includes the 15.4% of households with the highest annual household expenditure (Table 8).
| Frequency | Monthly household expenditure in birr | ||||
|---|---|---|---|---|---|
| Lower limit | Upper limit | Range | |||
| 1 | poor | 52 | 2938 | 4030 | 1097 |
| 2 | medium | 305 | 4040 | 5775 | 1735 |
| 3 | rich | 65 | 5775 | 6955 | 1180 |
Table 8: Household expenditure categories of the study population, who had followed up in Public Hospital of Addis Ababa September, 2016.
The primary aim of this study was to assess the out of pocket expenditure of hypertension to patients and their households in general. This study/descriptive analysis revealed that or the main finding of this study showed that the direct cost of study participant was estimated at median 283 (mean 290.74) birr per patient per month. Within the similar fashion this study showed that the total out pocket expenditure was estimated at median 5279.50 (mean 7194.00) birr/month, house hold expenditure was significant compared to direct cost which estimated at median 5148.50 (mean 5003.29) birr/month/patient and on average the patient monthly income and households monthly income was estimated at median 2125.00 (mean 2817.65 birr/month and median 3625.00 (at mean 4615.67 birr/month respectively. The multiple linear regression analysis revealed that, the total out of pocket expenditure was influenced by respondent gender, number of adult in household, household size, monthly income of households and wealth status within the households. The Principal component analysis revealed that, among the study population the wealth index category/status estimated that 12.3%, 72.3% and 15.4% for poor, medium and rich respectively.
To ensure the validity of the finding different process/mechanisms were applied. For instance; for durable asset/proxy indicator Principal components analysis (PCA) was applied as a variable reduction technique that shares many similarities to exploratory factor analysis. Its aim is to reduce a larger set of variables into a smaller set of variables, called ‘principal components’, which account for most of the variance in the original variables. Principal component analysis (PCA) is a statistical procedure that uses an orthogonal transformation to convert a set of observations of possibly correlated variables into a set of values of linearly uncorrelated variables called principal components. After the Assumption of the PCA was satisfied finally the wealth index category/wealth status within the households was obtained. Within the similar fashion the assumption of the linear regression was tested and after the assumption of linear regression was fulfilled the relation between dependent variable and independent variable was obtained. Not only this but also to ensure the validity of the finding short recall period (one month) recall period was used to avoid recall bias.
Ethiopia’s fifth national health accounts 2010/2011 assessed spending on general health and revealed that, Households manage 34 percent, all of their out-of-pocket health spending on general health. But The Economic burden of out of pocket expenditure of hypertension was not specifically addressed under sub account. Therefore as the primary aim of this study was to address this gap, the study found that the total out of pocket expenditure of hypertension patient and their households estimated at the median 5279.50 Ethiopian birr/month.
There was high burden of total out of pocket expenditure especially household expenditure or food and non-food expenditure, although there are considerable variations in household outcomes. This study shows that the monthly households’ expenditure for the poor was accounted for 2938 birr lower limit and 4030 birr upper limit. This appears to be higher when compared with the 2010/11 Ethiopian household’s consumption expenditure (HCE) survey was reported to be the monthly households’ expenditure for the poor wealth status was accounted for 947.50 lower limits and 1313.77 upper limit in Ethiopian birr even though the survey was at country level and the sample was high. Within the similar fashion this study shows that the monthly households’ expenditure with lower limit 4040 birr and 5775 birr upper limit for the medium wealth category and with lower limit 5775 birr and 6955 birr upper limit for the rich wealth category.
This still appears to be higher when compared with the 2010/11 Ethiopian household’s consumption expenditure (HCE) survey that shows the monthly households’ expenditure with lower limit 1313.77 birr and 1721 birr upper limit for the medium wealth category and at lower limit 1721.42 birr and 2362.20 birr upper limit for the rich wealth category.
The economic burden of total OOP expenditure tends to be concentrated among the poor. This appears to be significant as other studies done in low and middle income countries [7].
This study shows that the direct cost of hypertension was estimated at mean 290.74 birr (13.22 US dollar) per patient per month. This appears to be lower than the study done in south china in which the direct cost of the 487.3 US dollar [25].
Like the study done in China and India by wealth status within household out of pocket expenditure share increases with the increase in wealth status within households [26].
Strength of the study
Information required in calculating costs was based on an investigation of patients and their households rather than documenting review.
The first limitation of the study in patient hypertensive patients were excluded from the study. The second limitation of the study was Indirect cost (Loss of working time of person who is ill and caregivers, Loss of income of person who is ill and caregivers (due to absenteeism, missing business appointment, etc) calculation didn’t expressed in price rather than days lost.
The average costs of hypertension to patients and their households were very high when compared with the mean monthly household income. The total out of pocket expenditure was influenced by number of adult in household, household size, monthly income of households and wealth status within the study population.
The average OOPE of hypertension to patients and their households were very high when compared with the mean monthly household income. Therefore further research ought to be done including economic consequence, catastrophic Health expenditure, impoverishments, coping mechanism and social resources of hypertension on patients and their households. Health Policymakers and health managers should prioritize the resources need for the hypertension prevention and control activities.